draw_bounding_boxes()
在給定影像上繪製 bounding boxes,返回繪製了 bounding boxes 的 dtype uint8 的影像 Tensor。
draw_bounding_boxes(
    image: Tensor,
    boxes: Tensor,
    labels: Optional[List[str]] = None,
    colors: Optional[Union[List[Union[str, Tuple[int, int, int]]], str, Tuple[int, int, int]]] = None,
    fill: Optional[bool] = False,
    width: int = 1,
    font: Optional[str] = None,
    font_size: Optional[int] = None) → Tensor
| 參數 | 說明 |
|---|---|
| image | (Tensor) – 形狀是 (C x H x W) 和 dtype uint8 的 tensor。(其值介於[0, 255]) |
| boxes | (Tensor) – 形狀是 (N, 4) 的 tensor,包含 (xmin, ymin, xmax, ymax) 格式的 bounding boxes (邊界框)。boxes 是相對於影像的絕對坐標,也就是 0 <= xmin < xmax w< code> and |
| labels | (List[str]) – 包含 bounding boxes 標籤的 List。List containing the labels of bounding boxes. |
| colors | (Color or list of colors) – 包含 boxes 顏色或所有 boxes 單一顏色的列表。 顏色可以表示為 PIL strings (例如: red 或 #FF00FF) 或作為 RGB tuples (例如: (240, 10, 157))。預設情況下,為 boxes 生成隨機顏色。 |
| fill | (bool) – 如果為 True,則用指定顏色填充 bounding box。(半透明) |
| width | (int) – bounding box 的寬度。 |
| font | (str) – 包含 TrueType 字體的檔案名稱。如果找不到該檔案,載入程序還可能在其他目錄中搜索。例如: Windows 上的 fonts/ 目錄或/Library/Fonts/、/System/Library/Fonts/ 和 在 macOS 上的 ~/Library/Fonts/。 |
| font_size | (int) – font 參數請求的字體大小 (以 points 為單位)。預設是 10。如果未設置 font,font_size 將被忽略。 |
import torch
import matplotlib.pyplot as plt
import torchvision.transforms as T
from PIL import Image
from torchvision.utils import draw_bounding_boxes

# Define transform
to_tensor = T.PILToTensor()
to_pil = T.ToPILImage()

# Load an image using PIL, Convert image
image = Image.open('106526100_p0.jpg')
image_tensor = to_tensor(image)

# Define some bounding boxes and labels
boxes = torch.tensor([
    [50, 50, 550, 550],
    [200, 200, 750, 750]])

labels = ["cat", "dog"]
font_path = r"C:\Windows\consola.ttf"

# Draw bounding boxes on the image
output_image_tensor = draw_bounding_boxes(image_tensor,
                                          boxes,
                                          labels=labels,
                                          width=10,
                                          font=font_path,
                                          font_size=60)

# Convert tensor to PIL Image and save
output_image = to_pil(output_image_tensor)
output_image.save("image_bounding_boxes.png")

# =========================================================
# Visualize images
fig, axes = plt.subplots(1, 2)
axes[0].imshow(image)
axes[0].set_title('Original Image')
axes[1].imshow(output_image)
axes[1].set_title('Transformed Image')
plt.show()
執行結果:

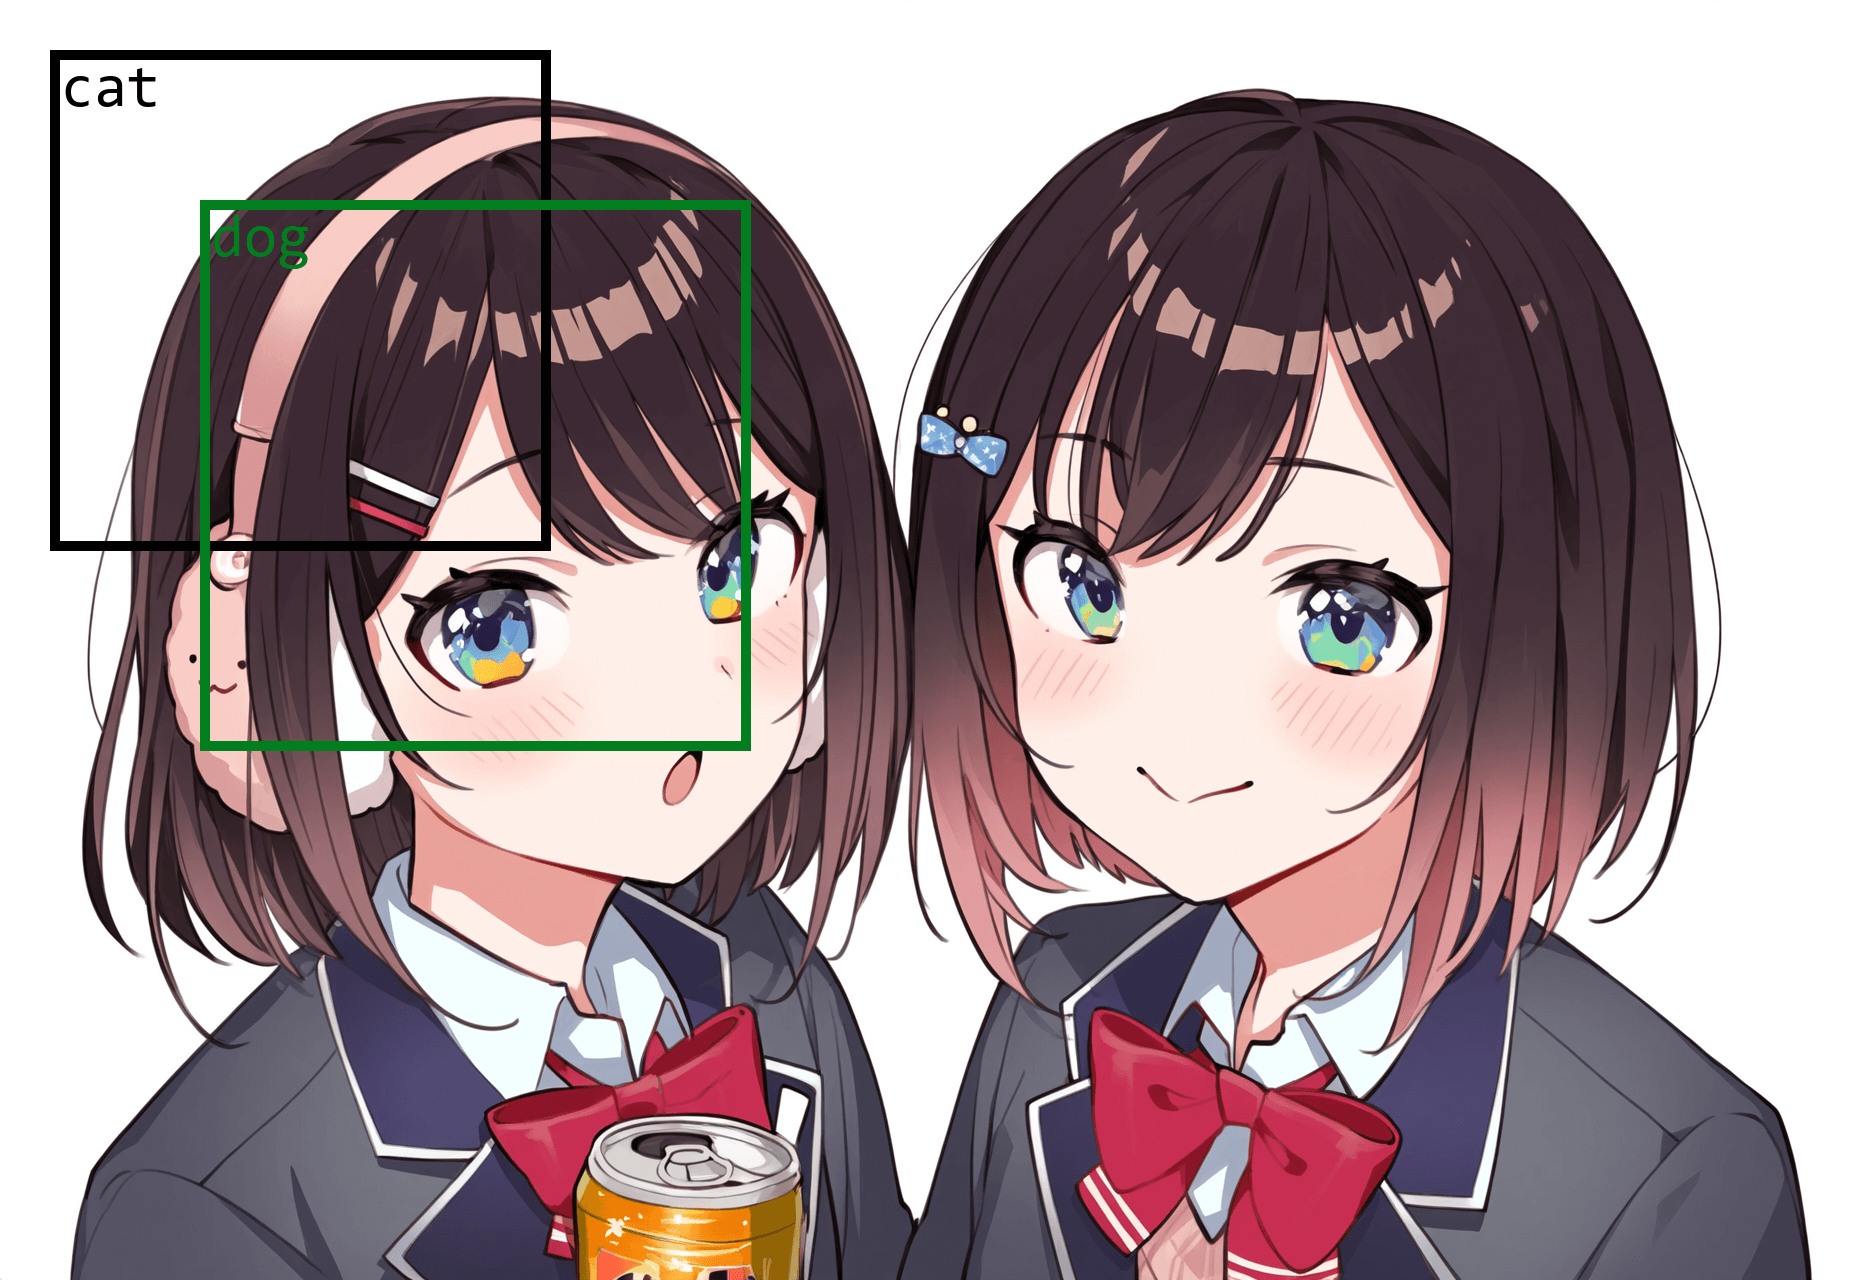
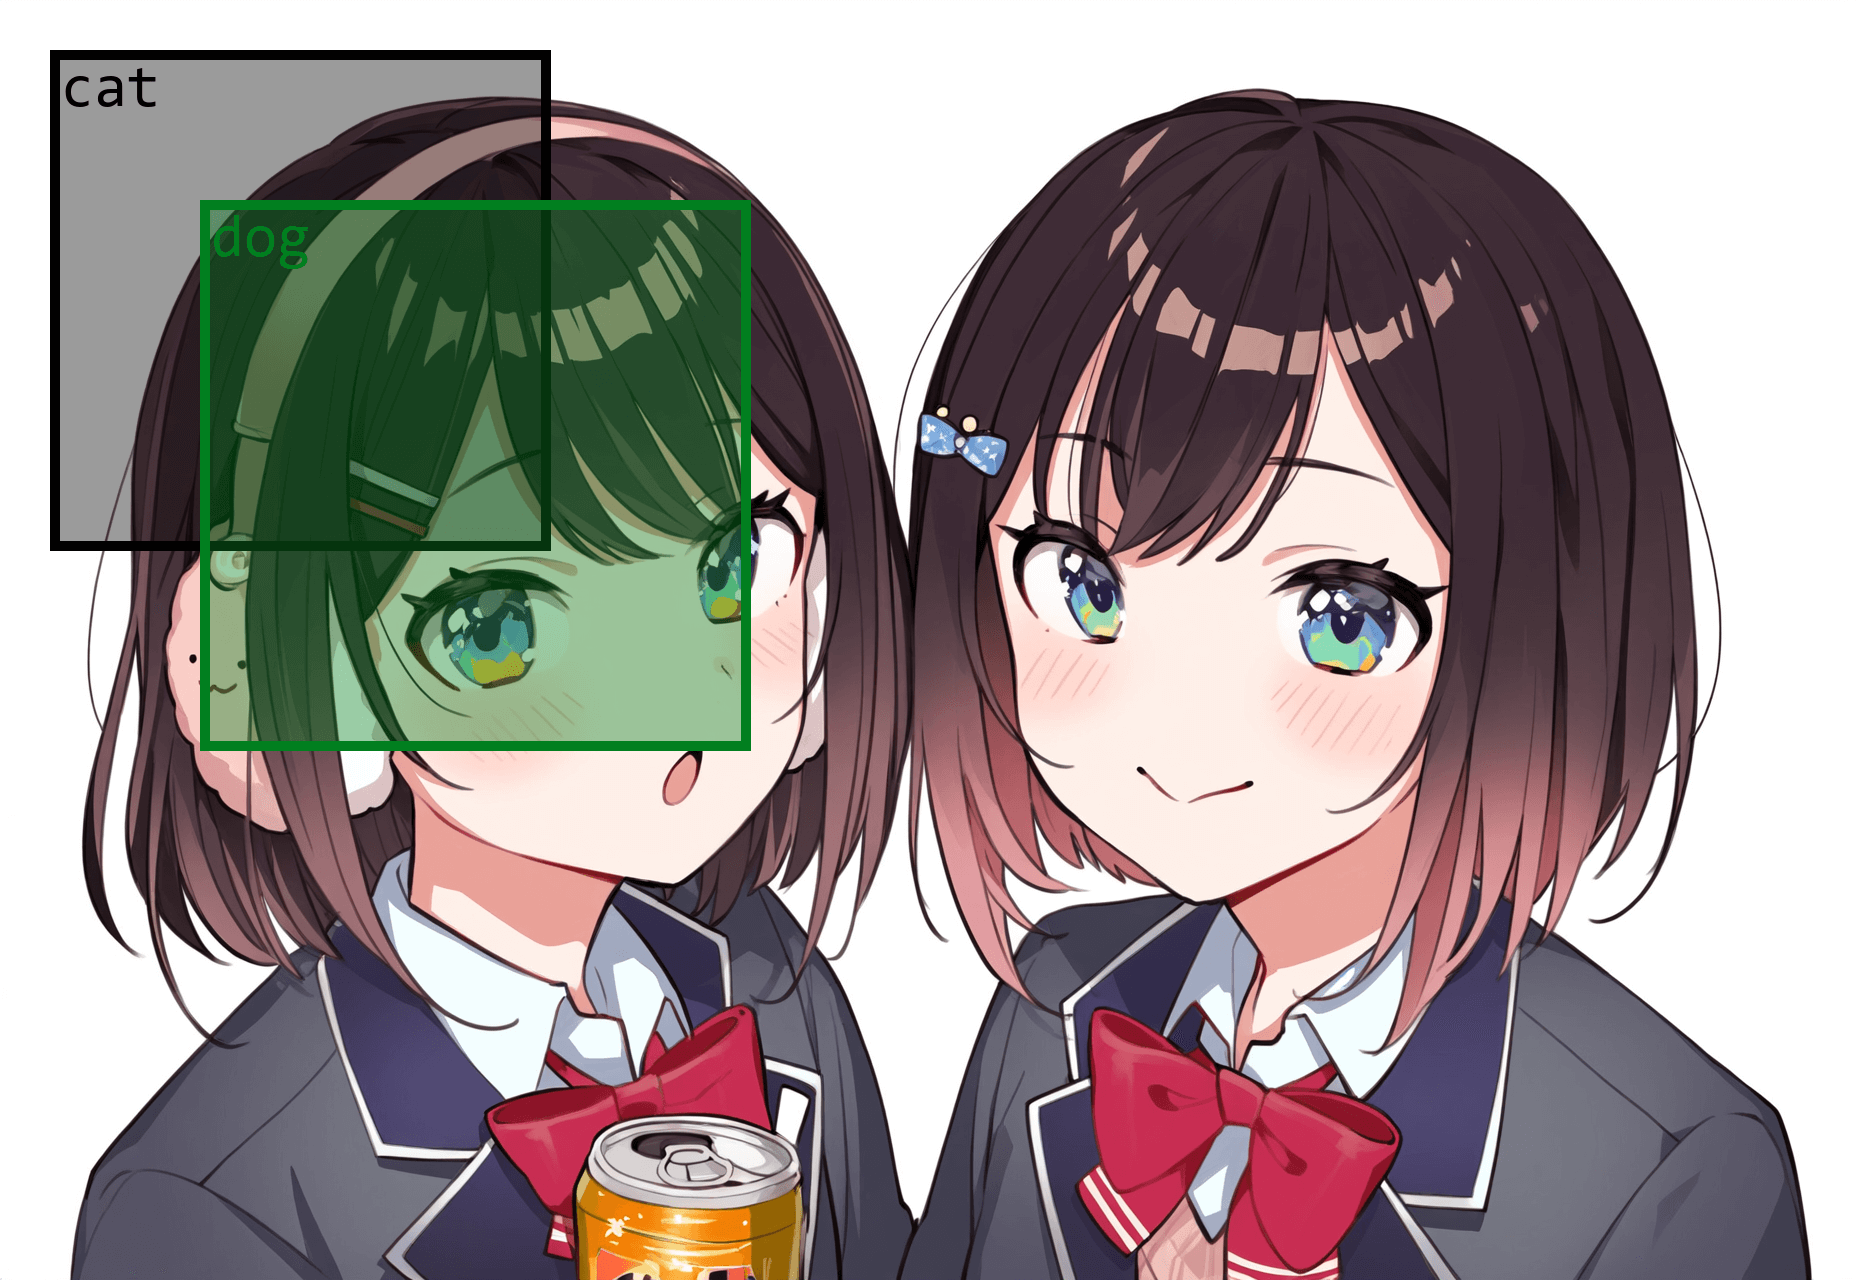
a: 輸入, b: 輸出 fill=False, c: 輸出 fill=True
draw_segmentation_masks()
在給定的 RGB 影像上繪製 segmentation masks (分割遮罩)。
draw_segmentation_masks(
    image: Tensor,
	masks: Tensor,
	alpha: float = 0.8,
	colors: Optional[Union[List[Union[str, Tuple[int, int, int]]], str, Tuple[int, int, int]]] = None) → Tensor
| 參數 | 說明 |
|---|---|
| image | (Tensor) – 形狀是 (3, H, W) 和 dtype uint8 的 Tensor。(其值介於[0, 255]) |
| masks | (Tensor) – 形狀是 (num_masks, H, W) 或 (H, W),且 dtype bool 的 Tensor。 |
| alpha | (float) – 0 到 1 之間的浮點數,表示 masks 的透明度。 0 表示完全透明,1 表示不透明。值太高可能會掩蓋原始影像,而太低可能會使 make 無法區分。 |
| colors | (Color or list of colors) – 包含 boxes 顏色或所有 boxes 單一顏色的列表。 顏色可以表示為 PIL strings (例如: red 或 #FF00FF) 或作為 RGB tuples (例如: (240, 10, 157))。預設情況下,為 boxes 生成隨機顏色。 |
import torch
import matplotlib.pyplot as plt
import torchvision.transforms as T
from PIL import Image
from torchvision.utils import draw_segmentation_masks

# Define transform
to_tensor = T.PILToTensor()
to_pil = T.ToPILImage()

# Load an image using PIL, Convert image
image = Image.open('FNz9nO3UYAINvOQ.jpg').convert("RGB") # twitter @ui_shig
image_tensor = to_tensor(image)
print(image.size)

# Create dummy masks for visualization.
# Assume 2 masks for this image. Could be more in real scenarios.
mask1 = torch.zeros((image.size[1], image.size[0]), dtype=torch.bool)
mask1[250:700, 250:700] = True  # a square in the center

mask2 = torch.zeros((image.size[1], image.size[0]), dtype=torch.bool)
mask2[300:650, 300:650] = True  # a smaller square in the center

masks = torch.stack([mask1, mask2]) # shape = (num_masks, H, W)

# Draw the masks on the image
overlayed_img = draw_segmentation_masks(image_tensor, masks, alpha=0.5)

# Convert tensor to PIL Image and save
output_image = to_pil(overlayed_img)
output_image.save("image_overlayed.png")

# =========================================================
# Visualize images
fig, axes = plt.subplots(1, 2)
axes[0].imshow(image)
axes[0].set_title('Original Image')
axes[1].imshow(output_image)
axes[1].set_title('Transformed Image')
plt.show()
執行結果:

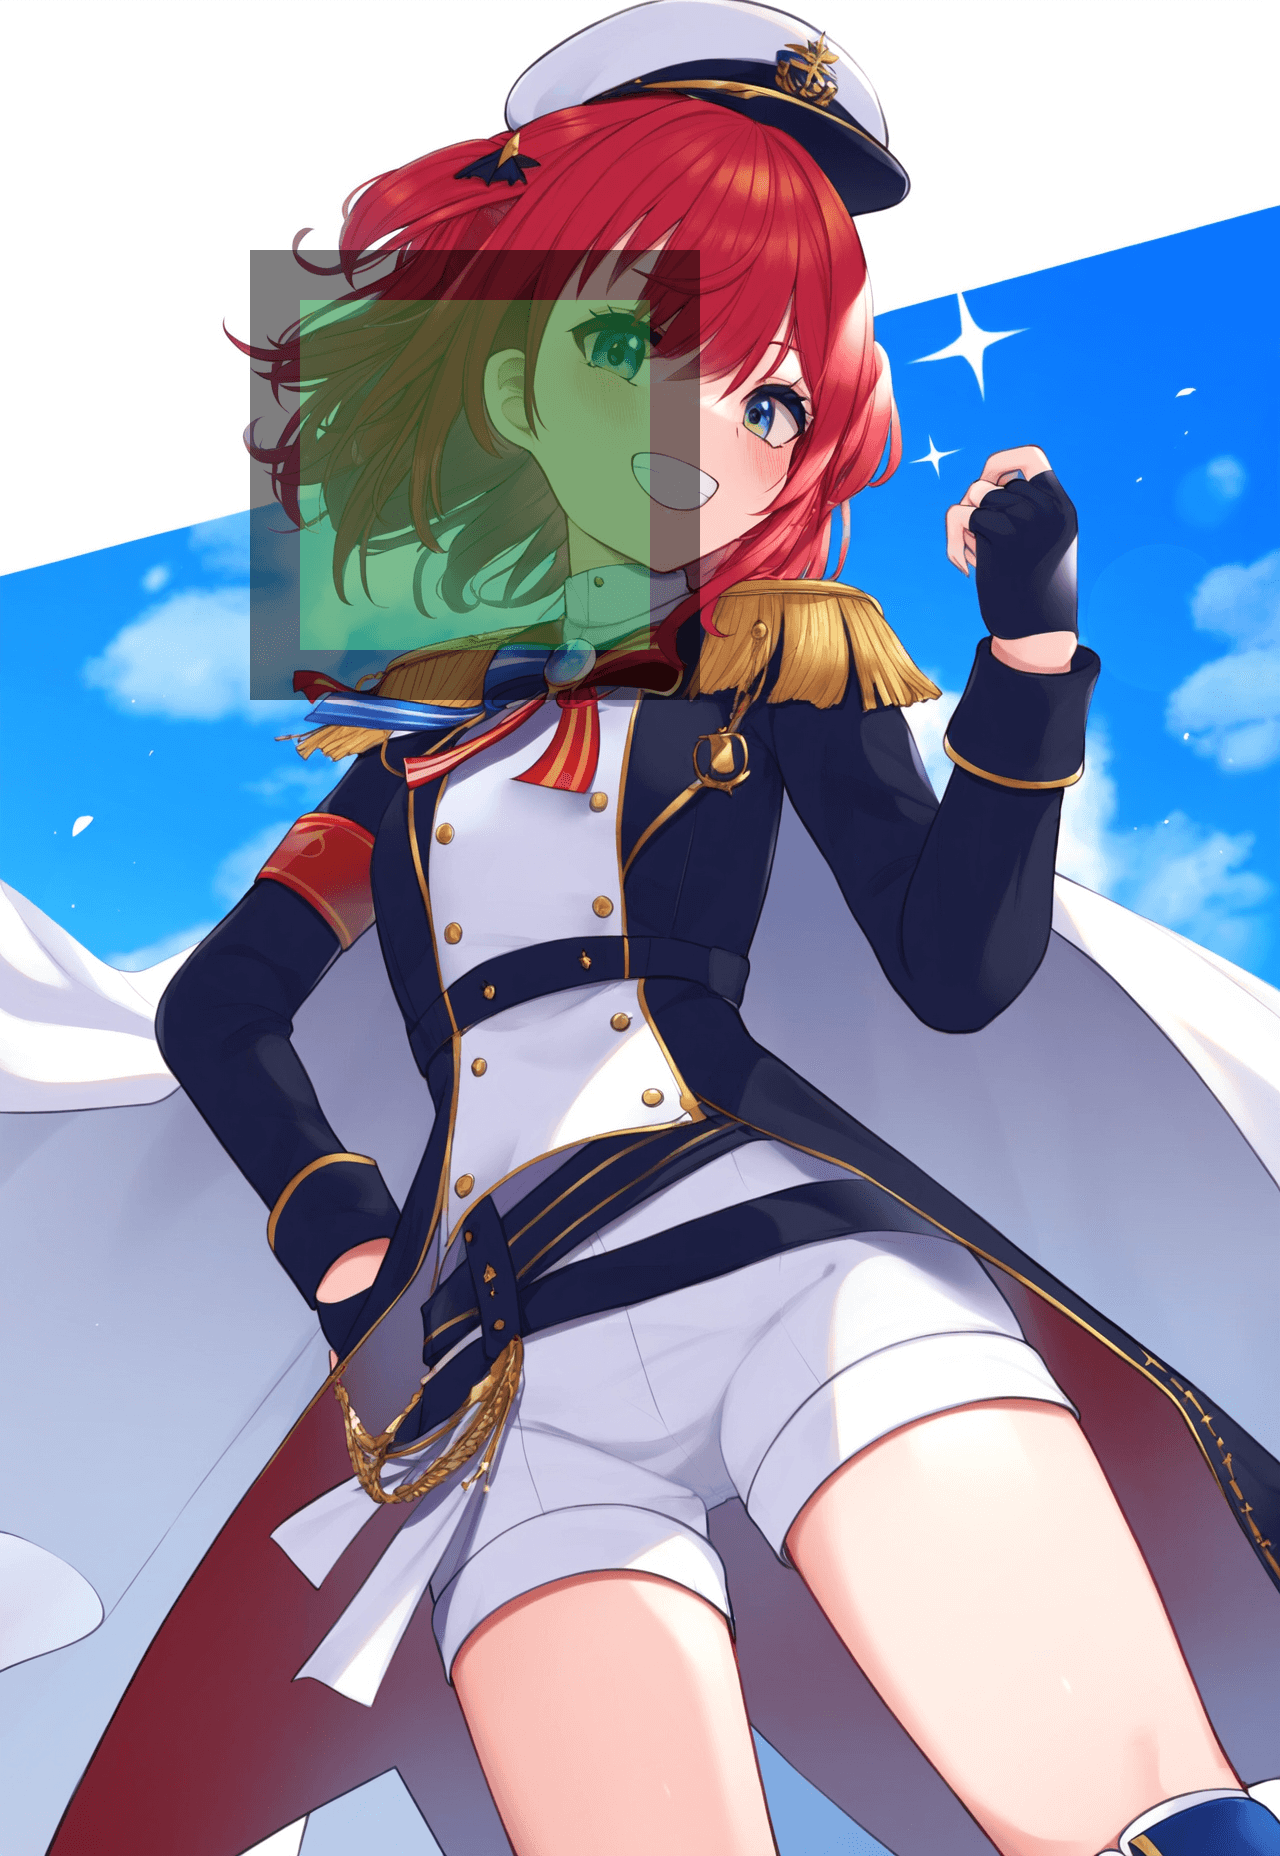
a: 輸入, b: 輸出
draw_keypoints()
在給定的 RGB 影像上繪製 keypoints (關鍵點)。
draw_keypoints(image: Tensor,
			   keypoints: Tensor,
			   connectivity: Optional[List[Tuple[int, int]]] = None,
			   colors: Optional[Union[str, Tuple[int, int, int]]] = None,
			   radius: int = 2,
			   width: int = 3) → Tensor
| 參數 | 說明 |
|---|---|
| image | (Tensor) – 形狀是 (3, H, W) 和 dtype uint8 的 Tensor。(其值介於[0, 255]) |
| keypoints | (Tensor) – 形狀是 (num_instances, K, 2) 的 Tensor,其中 num_instances 表示影像中物體或實例的數量,K 表示每個實例的 keypoints 數量,最後一個維度表示每個 keypoint 的 (x, y) 坐標。 |
| connectivity | (List[Tuple[int, int]]) – 該參數透過 keypoints 索引,決定 keypoints 如何與線連接。 |
| colors | (str, Tuple) – 指定繪製 keypoints 的顏色。顏色可以表示為 PIL strings (例如: red 或 #FF00FF) 或作為 RGB tuples (例如: (240, 10, 157))。 |
| radius | (int) – 每個 keypoint 的圓的半徑。 |
| width | (int) – 指定連接 keypoints 的線的寬度。 |
import torch
import torchvision.utils as utils
import matplotlib.pyplot as plt

# Image of shape [3, 256, 256]
image = torch.zeros(3, 256, 256, dtype=torch.uint8)

# 1 instance with 3 keypoints, shape = [1, 3, 2]
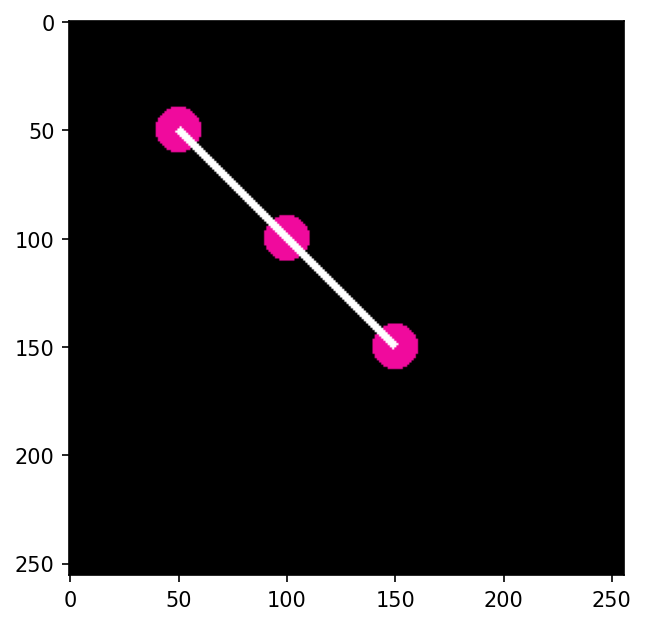
keypoints = torch.tensor([[[50, 50], [100, 100], [150, 150]]])

# Draw keypoints on the image
output = utils.draw_keypoints(image,
                              keypoints,colors=(240, 10, 157),
                              radius=10,
                              width=5,
                              connectivity=[(0,1), (1,2)])

# Visualize
plt.imshow(output.permute(1, 2, 0))
plt.savefig('plot.png', bbox_inches='tight', dpi = 150)
plt.show()
執行結果:
import torch
import torchvision.utils as utils
import matplotlib.pyplot as plt

# Image of shape [3, 256, 256]
image = torch.zeros(3, 256, 256, dtype=torch.uint8)

# Multiple Instances with Different Colors, shape = [2, 2, 2]
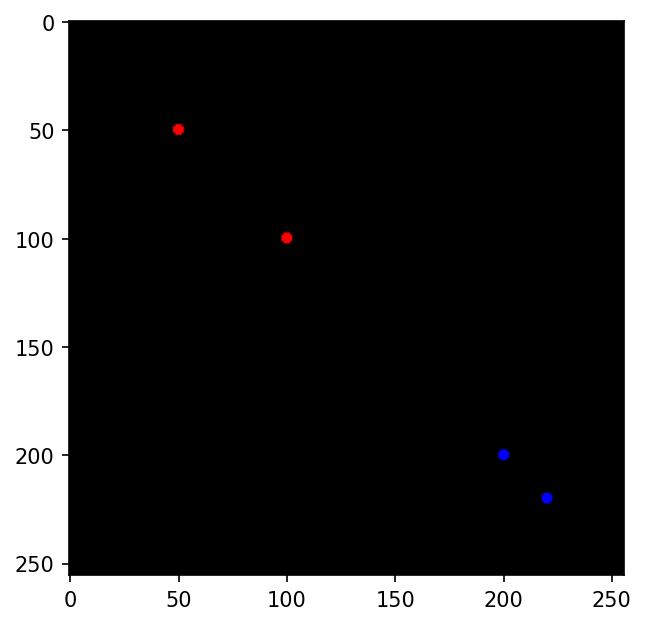
keypoints = torch.tensor([[[50, 50], [100, 100]], [[200, 200], [220, 220]]])
colors = ["red", "blue"]

# Draw keypoints on the image
for idx, color in enumerate(colors):
    image = utils.draw_keypoints(image, keypoints[idx].unsqueeze(0), colors=color)

# Visualize
plt.imshow(image.permute(1, 2, 0))
plt.savefig('plot.png', bbox_inches='tight', dpi = 150)
plt.show()
執行結果:
import torch
import matplotlib.pyplot as plt
import torchvision.transforms as T
from PIL import Image
from torchvision.utils import draw_keypoints

# Define transform
to_tensor = T.PILToTensor()
to_pil = T.ToPILImage()

# Load an image using PIL, Convert image
image = Image.open('FNz9n41VUAIPnip.jpg').convert("RGB")
image_tensor = to_tensor(image)
print(image.size)

# 1 instance with 3 keypoints, shape = [1, 3, 2]
keypoints = torch.tensor([[[50, 50], [200, 200], [450, 450]]])

# Draw keypoints on the image
output_image_tensor = draw_keypoints(image_tensor,
                                     keypoints,colors=(240, 10, 157),
                                     radius=30,
                                     width=10,
                                     connectivity=[(0,1), (1,2)])

# Convert tensor to PIL Image and save
output_image = to_pil(output_image_tensor)
output_image.save("image_overlayed.png")

# =========================================================
# Visualize images
fig, axes = plt.subplots(1, 2)
axes[0].imshow(image)
axes[0].set_title('Original Image')
axes[1].imshow(output_image)
axes[1].set_title('Transformed Image')
plt.show()
執行結果:
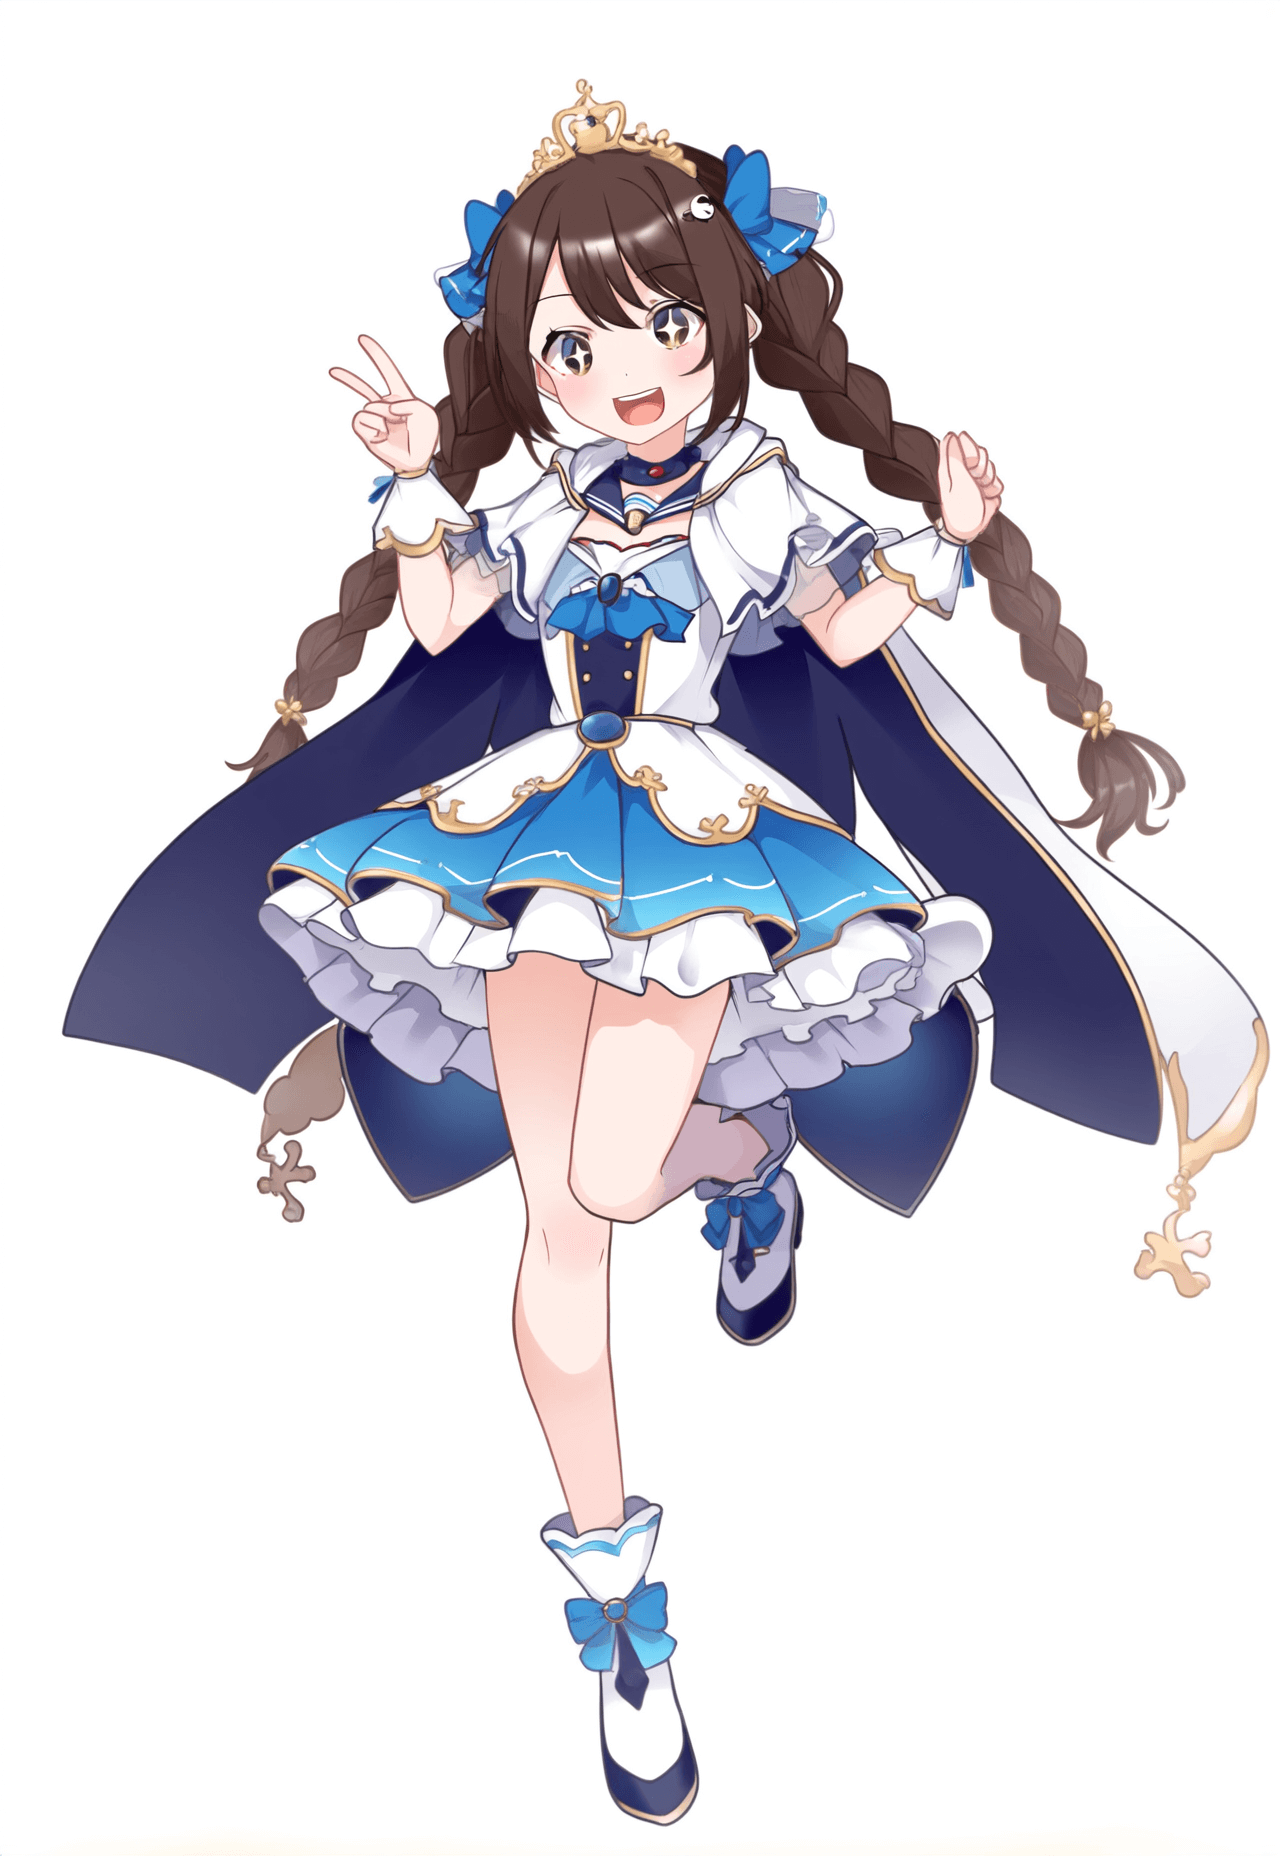
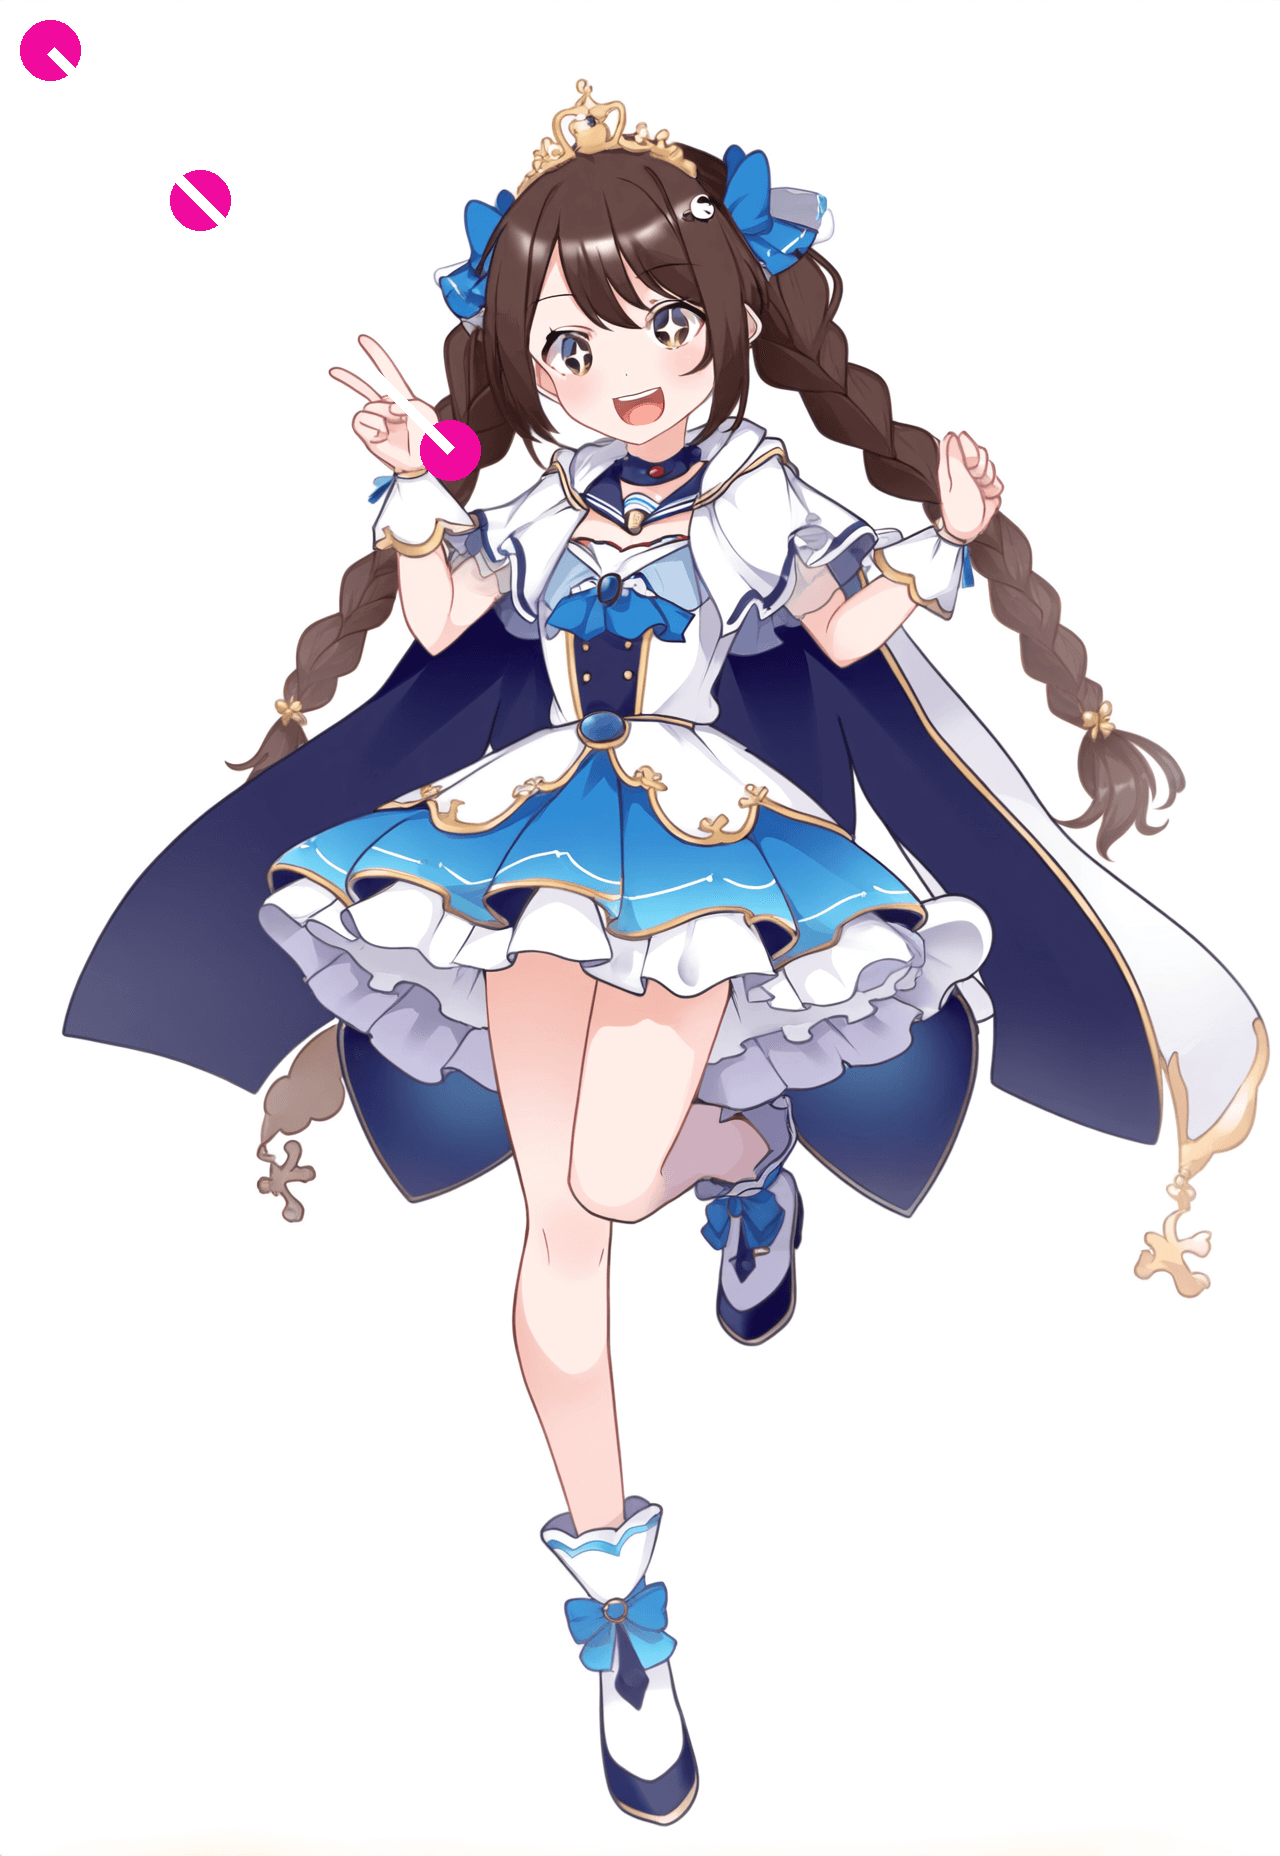
a: 輸入, b: 輸出
make_grid()
製作影像網格 (grid)。
make_grid(tensor: Union[Tensor, List[Tensor]],
		  nrow: int = 8,
		  padding: int = 2,
		  normalize: bool = False,
		  value_range: Optional[Tuple[int, int]] = None,
		  scale_each: bool = False,
		  pad_value: float = 0.0,
		  **kwargs) → Tensor
| 參數 | 說明 |
|---|---|
| tensor | (Tensor or list) – 形狀是 (B x C x H x W) 的 4D mini-batch Tensor 或大小相同的影像 List。 |
| nrow | (int) – Grid 每行 (row) 中,顯示的影像數量。最終 grid 輸出形狀是 (B/nrow, nrow)。 |
| padding | (int) – 邊界的填充量。 |
| normalize | (bool) – 如果是 True,則按照 value_range 指定的最小值和最大值,將影像移動到範圍 (0, 1)。normalize 數學式等效: $tensor = \frac{tensor - min}{max - min}$。 |
| value_range | (tuple) – Tuple (min, max),其中 min 和 max 是數字,用於標準化影像。預設情況下,返回 tensor 的最小值和最大值。 |
| scale_each | (bool) – 如果是 True,則分別縮放影像 batch 中的每個影像,而不是縮放所有影像的 (min, max)。 |
| pad_value | (float) – 填充像素的值。 |
import torch
import torchvision.utils as vutils
import matplotlib.pyplot as plt

# Create a batch of 4 images with 3 channels (e.g., RGB), 64x64 resolution.
# This is just random data for illustration. Shape = (4, 3, 64, 64).
images = torch.randn(4, 3, 64, 64)

# Make a grid out of these images
grid = vutils.make_grid(images, padding=2, normalize=True)

# Convert grid to a numpy array for visualization using matplotlib
grid_np = grid.numpy().transpose((1, 2, 0))

# Display the grid
plt.imshow(grid_np)
plt.savefig('plot.png', bbox_inches='tight', dpi = 150)
plt.show()
執行結果:


a: 輸出, b: 輸出, padding=6
save_image()
將給定的 Tensor 儲存到影像檔案中。
save_image(tensor: Union[Tensor, List[Tensor]],
		   fp: Union[str, Path, BinaryIO],
		   format: Optional[str] = None,
		   **kwargs) → None
| 參數 | 說明 |
|---|---|
| tensor | (Tensor or list) – 要儲存的影像 ,形狀是 (C, H, W)。如果給定一個 mini-batch tensor ((B, C, H, W)),則透過調用 make_grid() 將 tensor 儲存為影像 grid。 |
| fp | (string or File object) – 檔案名稱或檔案物件。 |
| format | (str) – 如果省略,則使用的格式由檔案名稱副檔名確定。如果使用 File object,而不是檔案名稱,則應始終使用此參數。 |
| **kwargs | 其他關鍵字參數將傳遞給 make_grid()。 |
import torch
import torchvision.utils as vutils

# Generate a dummy image tensor
image = torch.randn(3, 256, 256)  # A random image with C=3, H=256, W=256

# Save the image
vutils.save_image(image, 'single_image.png', normalize=True)

# Generate a dummy batch of images
batch_images = torch.randn(32, 3, 64, 64)  # 32 random images with C=3, H=64, W=64

# Save the batch of images as a grid
vutils.save_image(batch_images, 'image_grid.png', nrow=8, normalize=True)
執行結果:

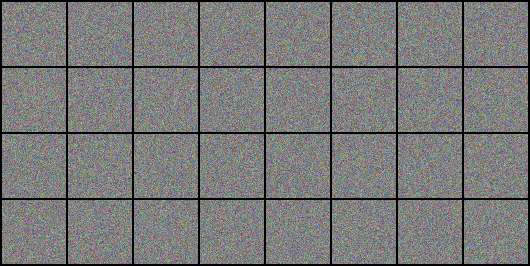
a: 輸出, b: 輸出, nrow=8
flow_to_image()
將 flow 轉換為 RGB 影像。
flow_to_image — Torchvision 0.15 documentation
參考資料
draw_bounding_boxes — Torchvision 0.15 documentation
draw_segmentation_masks — Torchvision 0.15 documentation
draw_keypoints — Torchvision 0.15 documentation

