calcHist()
用於計算影像或影像 feature 的 histogram (直方圖)。Histogram 是影像中像素強度 (或任何其他影像屬性)分佈的圖形表示。
void cv::calcHist(
	const Mat* images,
	int nimages,
	const int* channels,
	InputArray mask,
	OutputArray hist,
	int dims,
	const int* histSize,
	const float** ranges,
	bool uniform = true,
	bool accumulate = false)
| 參數 | 說明 |
|---|---|
| images | 將要計算 histograms 的 source images array 的 pointer。這些影像必須具有相同的深度 (例如: CV_8U、CV_32F),但可以具有不同數量的 channels。您需要傳遞包含一個或多個影像的 array 的 address。 |
| nimages | 指定 source images 的數量 (images 陣列的大小)。如果您正在計算影像的 histogram,則應將其設為 1。 |
| channels | 指定計算 histogram 的 channels。例如: 如果您有彩色影像並且想要計算藍色 channel 的 histogram,則可以將 channels 設為 [0]。 |
| mask | 可讓您指定 mask。如果提供了 mask,則將僅針對輸入 array(s) 的 masked 元素計算 histogram。Mask 影像必須是與輸入影像大小相同的 8-bit array。 |
| hist | 輸出 histogram,通常是稠密或稀疏的 multidimensional array。 |
| dims | 指定 histogram 的 dimensionality 。對於 1D histogram,值為 1。對於 2D histogram,值為 2。(例如: 影像的 hue 和 saturation值) |
| histSize | 指定每個維度的 bin 數量。例如: 要為 1D histogram 建立包含 256 個 bin 的 histogram,您將傳遞一個指向值為 256 的 int 的 pointer。 |
| ranges | 一個 array,指定了每個維度的 bin 邊界。對於像素值範圍從 0 到 255 的 1D histogram,ranges 參數可以是 [0, 256]。 |
| uniform | 此參數指定 histogram bins 是否 uniform (均勻;等距)。對於大多數應用程序,通常保留為 true 。如果 bin 不均勻,則應將其設為 false。 |
| accumulate | 如果設為 true,則 histogram 一開始不會被清除。當您想要透過多次呼叫累積 histograms 時,這非常有用。 |
accumulate 參數這對於隨著時間的推移或跨影像的各個區域,累積一系列直方圖,很有用。
這是一個 overloaded member 函數,為方便起見而提供。它與上述函數的差異僅在於它所接受的引數。
void cv::calcHist(
    InputArrayOfArrays images,
    const std::vector<int>& channels,
    InputArray mask,
    OutputArray hist,
    const std::vector<int>& histSize,
    const std::vector<float>& ranges,
    bool accumulate = false)
這是一個 overloaded member 函數,為方便起見而提供。它與上述函數的差異僅在於它所接受的引數。
void cv::calcHist(
    const Mat* images,
    int nimages,
    const int* channels,
    InputArray mask,
    SparseMat& hist, int dims,
    const int* histSize,
    const float** ranges,
    bool uniform = true,
    bool accumulate = false)
Example1: Basic usage
#include <iostream>
#include <opencv2/opencv.hpp>

using namespace cv;
using namespace std;

int main() {
  // Read the image
  Mat img = imread("sakura.png");
  if (img.empty()) {
    std::cerr << "Error: Image not found" << std::endl;
    return -1;
  }

  // Convert to grayscale
  Mat gray;
  cvtColor(img, gray, cv::COLOR_BGR2GRAY);

  // Parameters for histogram
  int histSize = 256;        // number of bins
  float range[] = {0, 256};  // the upper boundary is exclusive
  const float* histRange = {range};
  bool uniform = true, accumulate = false;
  Mat hist;

  calcHist(&gray, 1, 0, Mat(), hist, 1, &histSize, &histRange, uniform,
           accumulate);

  // Display the histogram
  int hist_w = 512, hist_h = 400;
  int bin_w = cvRound((double)hist_w / histSize);
  Mat histImage(hist_h, hist_w, CV_8UC1, Scalar(0, 0, 0));
  normalize(hist, hist, 0, histImage.rows, NORM_MINMAX, -1, Mat());

  for (int i = 1; i < histSize; i++) {
    line(histImage,
         Point(bin_w * (i - 1), hist_h - cvRound(hist.at<float>(i - 1))),
         Point(bin_w * (i), hist_h - cvRound(hist.at<float>(i))), Scalar(255),
         2, 8, 0);
  }

  imwrite("Histogram.png", histImage);
  return 0;
}
執行結果:


a: 輸入。b: 輸出。
Example 2: 處理多個影像
#include <iostream>
#include <opencv2/opencv.hpp>
#include <vector>

using namespace cv;
using namespace std;

int main() {
  // Load multiple images
  vector<Mat> images;
  images.push_back(imread("angel.png"));
  images.push_back(imread("sakura.png"));
  // Add more images as needed

  // Convert images to grayscale and store them in a new vector
  vector<Mat> grayImages;
  for (size_t i = 0; i < images.size(); ++i) {
    Mat gray;
    cvtColor(images[i], gray, COLOR_BGR2GRAY);
    grayImages.push_back(gray);
  }

  // Parameters for histogram
  int histSize = 256;        // number of bins
  float range[] = {0, 256};  // the upper boundary is exclusive
  const float* histRange = {range};
  bool uniform = true, accumulate = false;
  Mat hist;

  // Compute histogram for each image and accumulate
  for (size_t i = 0; i < grayImages.size(); ++i) {
    Mat histTemp;
    calcHist(&grayImages[i], 1, 0, Mat(), histTemp, 1, &histSize, &histRange,
             uniform, accumulate);
    if (i == 0) {
      hist = histTemp.clone();
    } else {
      hist += histTemp;
    }
  }

  // Display the accumulated histogram
  int hist_w = 512, hist_h = 400;
  int bin_w = cvRound((double)hist_w / histSize);
  Mat histImage(hist_h, hist_w, CV_8UC1, Scalar(0, 0, 0));
  normalize(hist, hist, 0, histImage.rows, NORM_MINMAX, -1, Mat());

  for (int i = 1; i < histSize; i++) {
    line(histImage,
         Point(bin_w * (i - 1), hist_h - cvRound(hist.at<float>(i - 1))),
         Point(bin_w * (i), hist_h - cvRound(hist.at<float>(i))), Scalar(255),
         2, 8, 0);
  }

  imwrite("AccumulatedHistogram.png", histImage);
  return 0;
}
執行結果:


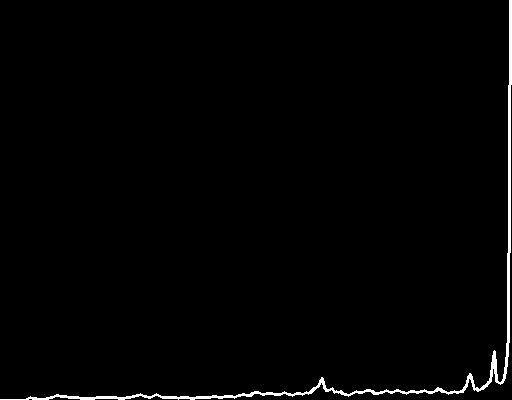
a: 輸入。b: 輸入。c: 輸出。
Example1: 灰度影像
#include <vector>
#include <iostream>
#include <opencv2/imgcodecs.hpp>
#include <opencv2/imgproc.hpp>
#include <opencv2/opencv.hpp>
#include <matplot/matplot.h>

int main() {
  namespace plt = matplot;

  // Read the image
  cv::Mat img = cv::imread("sakura.png");
  if (img.empty()) {
    std::cerr << "Error: Image not found" << std::endl;
    return -1;
  }

  // Convert to grayscale
  cv::Mat gray;
  cv::cvtColor(img, gray, cv::COLOR_BGR2GRAY);

  // Calculate the histogram
  int histSize = 256;
  float range[] = {0, 256};  // the upper boundary is exclusive
  const float* histRange = {range};
  bool uniform = true, accumulate = false;
  cv::Mat b_hist;
  cv::calcHist(&gray, 1, 0, cv::Mat(), b_hist, 1, &histSize,
               &histRange, uniform, accumulate);

  // Calculate the total number of pixels by summing the histogram
  double total = cv::sum(b_hist)[0];
  std::cout << "Total pixels: " << total << std::endl;

  // Convert histogram to a format suitable for matplotlib-cpp
  std::vector<double> histData;
  histData.assign(b_hist.begin<float>(), b_hist.end<float>());

  // Plot the histogram
  plt::plot(histData)->line_width(2);
  plt::title("Grayscale Histogram");
  plt::save("Grayscale Histogram.png");

  return 0;
}
執行結果:

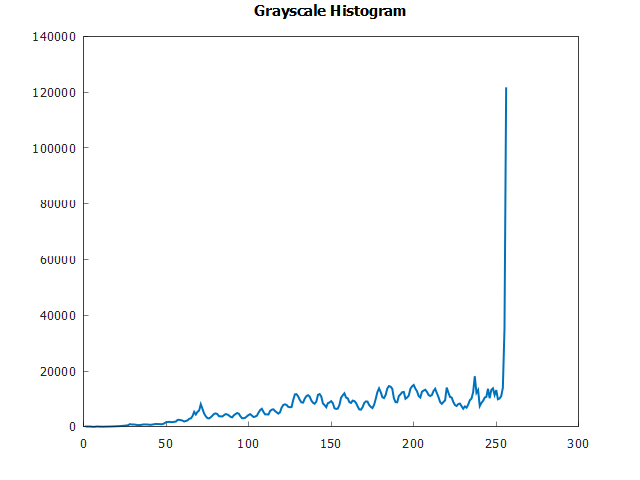
a: 輸入。b: 輸出。
Example 3: 彩色影像
#include <vector>
#include <opencv2/opencv.hpp>
#include <matplot/matplot.h>

int main() {
  namespace plt = matplot;

  // Load the image
  cv::Mat img = cv::imread("sakura.png");
  if (img.empty()) {
    std::cerr << "Error: Image cannot be loaded." << std::endl;
    return -1;
  }

  // Split the image into its respective Blue, Green, and Red channels
  std::vector<cv::Mat> bgr_planes;
  cv::split(img, bgr_planes);

  // Set the number of bins and the range for the histogram
  int histSize = 256;
  float range[] = {0, 256};  // the upper boundary is exclusive
  const float* histRange = {range};
  bool uniform = true;
  bool accumulate = false;

  // Vector to store histograms
  // Calculate the histograms for the Blue, Green, and Red channels
  cv::Mat b_hist, g_hist, r_hist;
  std::vector<cv::Mat> hist_planes = {b_hist, g_hist, r_hist};
  for (int i = 0; i < 3; i++) {
    cv::calcHist(&bgr_planes[i], 1, nullptr, cv::Mat(), hist_planes[i], 1,
                 &histSize, &histRange, uniform, accumulate);
  }

  // Convert histograms to vectors for plotting
  std::array color = {"b", "g", "r"};
  for (int i = 0; i < 3; i++) {
    std::vector<double> hist_vec;
    hist_vec.assign(hist_planes[i].begin<float>(), hist_planes[i].end<float>());
    plt::plot(hist_vec, color[i])->line_width(2);
    plt::hold(plt::on);
  }

  plt::save("Color Histogram.png");
  return 0;
}
執行結果:

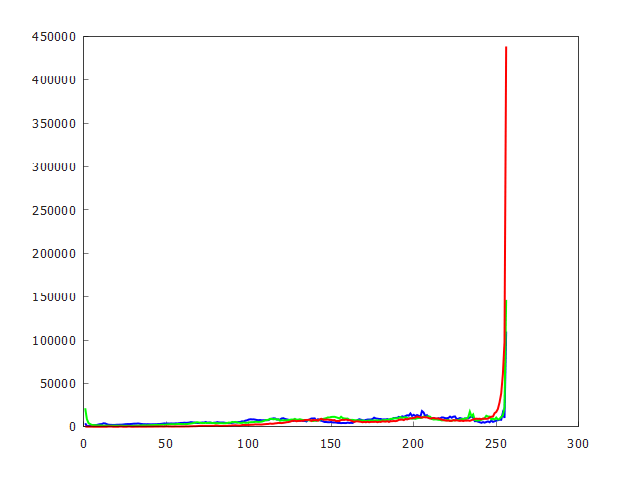
a: 輸入。b: 輸出。
Example 4: 累積多個影像的 histogram
假設您有一系列影像,並且您想要計算這些影像的 cumulative histogram (累積直方圖)。
#include <vector>
#include <iostream>
#include <opencv2/opencv.hpp>
#include <matplot/matplot.h>

int main() {
  namespace plt = matplot;

  std::vector<std::string> img_paths = {"sakura.png", "angel.png"};

  // Set the number of bins and the range for the histogram
  const int channels[] = {0};
  const int histSize[] = {256};
  float hranges[] = {0, 256};
  const float* ranges[] = {hranges};
  cv::Mat hist;
  cv::Mat cumulative_hist = cv::Mat::zeros(256, 1, CV_32F);

  for (const auto& img_path : img_paths) {
    // Load the image
    cv::Mat img = cv::imread(img_path, cv::IMREAD_GRAYSCALE);
    if (img.empty()) {
      std::cerr << "Error: Unable to open image " << img_path << std::endl;
      continue;
    }

    // Calculate the histograms true false
    cv::calcHist(&img, 1, channels, cv::Mat(), hist, 1, histSize, ranges, true,
                 false);      // accumulate is true
    cumulative_hist += hist;  // Update cumulative histogram

    std::cout << "Current Image Histogram Sum: " << cv::sum(hist)[0]
              << " Cumulative Histogram Sum: " << cv::sum(cumulative_hist)[0]
              << std::endl;
  }

  // Convert cumulative histogram to a format suitable for matplotlibcpp
  std::vector<double> x(256), y(256);
  for (int i = 0; i < 256; i++) {
    x[i] = i;
    y[i] = cumulative_hist.at<float>(i);
  }

  plt::plot(x, y)->line_width(2);
  plt::save("Cumulative Histogram for Multiple Images.png");
  return 0;
}
執行結果:
Current Image Histogram Sum: 1.83501e+06 Cumulative Histogram Sum: 1.83501e+06
Current Image Histogram Sum: 2.37568e+06 Cumulative Histogram Sum: 4.21069e+06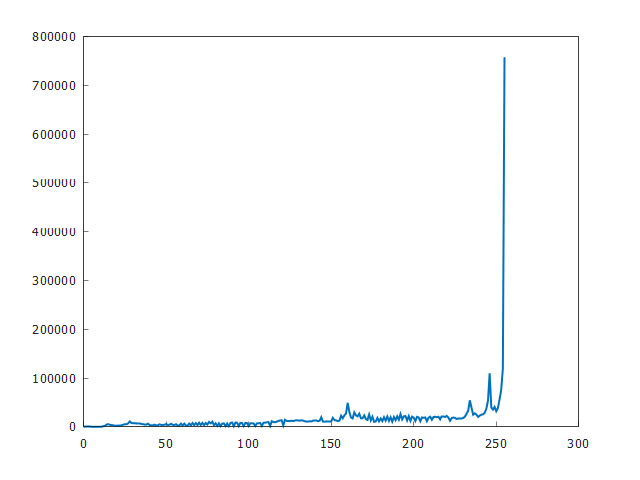
Example 5: 每個 Channel 的 Histogram
#include <iostream>
#include <string>
#include <vector>
#include <opencv2/opencv.hpp>
#include <matplot/matplot.h>

namespace plt = matplot;

/**
 * Plots and saves a histogram.
 *
 * @param data A vector of cv::Mat, each representing histogram data.
 * @param title The title of the plot.
 * @param xlabel The label for the X-axis.
 * @param ylabel The label for the Y-axis.
 * @param filename The filename where the plot will be saved.
 * @param colors (Optional) A vector of strings representing colors for each
 * plot line.
 */
static void plot_and_save_histogram(
    const std::vector<cv::Mat>& data, const std::string& title,
    const std::string& xlabel, const std::string& ylabel,
    const std::string& filename, const std::vector<std::string>& colors = {}) {

  if (!colors.empty()) {
    for (size_t i = 0; i < data.size(); ++i) {
      std::vector<double> x(256), y(256);
      for (int j = 0; j < 256; ++j) {
        x[j] = j;
        y[j] = data[i].at<float>(j);
      }

      plt::plot(x, y)->color(colors[i]).line_width(2);
      plt::hold(plt::on);
    }
  } else {
    std::vector<double> x(256), y(256);
    for (int j = 0; j < 256; ++j) {
      x[j] = j;
      y[j] = data[0].at<float>(j);
    }
    plt::plot(x, y)->line_width(2);
  }

  plt::title(title);
  plt::xlabel(xlabel);
  plt::ylabel(ylabel);
  plt::save(filename);
}

int main() {
  // Load the image
  cv::Mat img = cv::imread("sakura.png", cv::IMREAD_COLOR);
  if (img.empty()) {
    std::cerr << "Error opening image" << std::endl;
    return -1;
  }
  cv::Mat gray;
  cv::cvtColor(img, gray, cv::COLOR_BGR2GRAY);

  // Set the number of bins and the range for the histogram
  int channels[] = {0};
  int histSize[] = {256};
  float range[] = {0, 256};
  const float* histRange[] = {range};

  // Convert to grayscale and calculate histogram
  std::vector<cv::Mat> gray_hist(1);
  cv::calcHist(&gray, 1, channels, cv::Mat(), gray_hist[0], 1, histSize,
               histRange, true, false);

  // Calculate histograms for each color channel
  std::vector<cv::Mat> color_hists(3);
  std::vector<std::string> color_bgr = {"b", "g", "r"};
  for (int i = 0; i < 3; ++i) {
    cv::calcHist(&img, 1, &i, cv::Mat(), color_hists[i], 1, histSize, histRange,
                 true, false);
  }

  // Plot and save grayscale histogram
  plot_and_save_histogram(gray_hist, "Grayscale Histogram", "PixelIntensity",
                          "Frequency", "grayscale_histogram.png");

  // Plot and save color histogram
  plot_and_save_histogram(color_hists, "Color Histogram", "Pixel Intensity",
                          "Frequency", "color_histogram.png", color_bgr);

  // Print total pixel count for the grayscale image
  double totalPixelCount = cv::sum(gray_hist[0])[0];
  std::cout << "Total pixel count: " << totalPixelCount << std::endl;

  return 0;
}
執行結果:

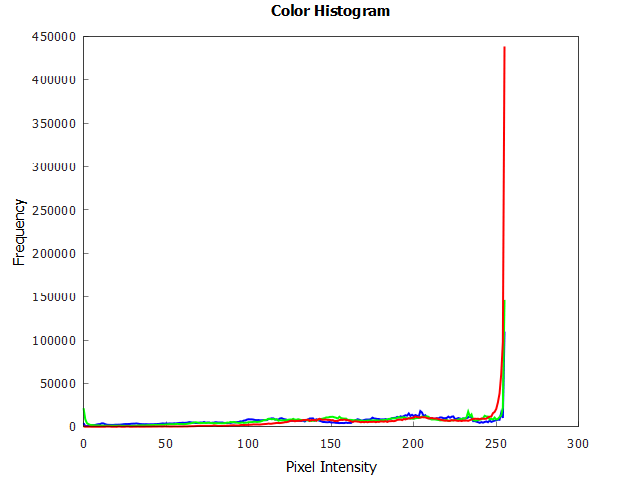
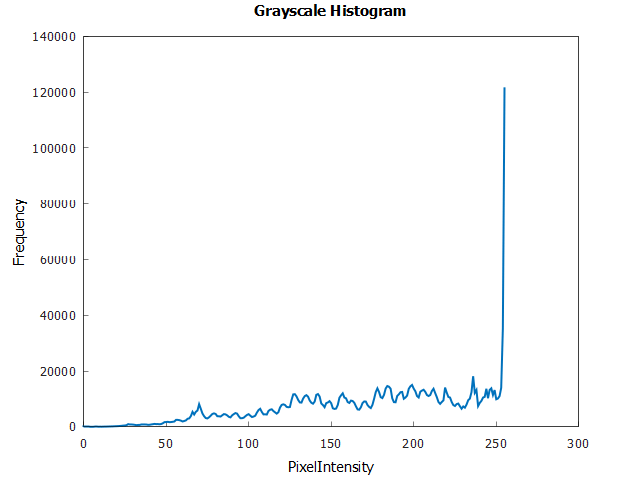
a: 輸入。b: 輸出。c: 輸出。
Example 6: Histogram Equalization (直方圖均衡)
這是透過擴展強度範圍,來提高影像 contrast (對比度) 的過程。
#include <iostream>
#include <string>
#include <vector>
#include <matplot/matplot.h>
#include <opencv2/opencv.hpp>

namespace plt = matplot;

/**
 * Plots and saves a histogram.
 *
 * @param data A vector of cv::Mat, each representing histogram data.
 * @param title The title of the plot.
 * @param xlabel The label for the X-axis.
 * @param ylabel The label for the Y-axis.
 * @param filename The filename where the plot will be saved.
 * @param colors (Optional) A vector of strings representing colors for each
 * plot line.
 */
static void plot_and_save_histogram(
    const std::vector<cv::Mat>& data, const std::string& title,
    const std::string& xlabel, const std::string& ylabel,
    const std::string& filename, const std::vector<std::string>& colors = {}) {
  if (!colors.empty()) {
    for (size_t i = 0; i < data.size(); ++i) {
      std::vector<double> x(256), y(256);

      for (int j = 0; j < 256; ++j) {
        x[j] = j;
        y[j] = data[i].at<float>(j);
      }

      plt::plot(x, y)->color(colors[i]).line_width(2);
      plt::hold(plt::on);
    }

  } else {
    std::vector<double> x(256), y(256);
    for (int j = 0; j < 256; ++j) {
      x[j] = j;
      y[j] = data[0].at<float>(j);
    }
    plt::plot(x, y)->line_width(2);
  }

  plt::title(title);
  plt::xlabel(xlabel);
  plt::ylabel(ylabel);
  plt::save(filename);
}

int main() {
  // Load the image
  cv::Mat img = cv::imread("sakura.png", cv::IMREAD_COLOR);
  if (img.empty()) {
    std::cerr << "Could not read the image." << std::endl;
    return 1;
  }

  // Convert to grayscale and calculate histogram
  cv::Mat gray, equ_img;
  cv::cvtColor(img, gray, cv::COLOR_BGR2GRAY);
  cv::equalizeHist(gray, equ_img);

  // Set the number of bins and the range for the histogram
  int histSize = 256;
  float range[] = {0, 256};
  const float* histRange = {range};
  bool uniform = true, accumulate = false;
  std::vector<cv::Mat> gray_hist(1), equ_hist(1);

  // Calculate histograms
  cv::calcHist(&gray, 1, 0, cv::Mat(), gray_hist[0], 1, &histSize, &histRange,
               uniform, accumulate);
  cv::calcHist(&equ_img, 1, 0, cv::Mat(), equ_hist[0], 1, &histSize, &histRange,
               uniform, accumulate);

  // Normalize the result to [0, histImage.rows]
  cv::normalize(gray_hist[0], gray_hist[0], 0, gray.rows, cv::NORM_MINMAX, -1,
                cv::Mat());
  cv::normalize(equ_hist[0], equ_hist[0], 0, equ_img.rows, cv::NORM_MINMAX, -1,
                cv::Mat());

  // Write images
  cv::imwrite("Gray Image.png", gray);
  cv::imwrite("Equalized Image.png", equ_img);

  // Plot and save histograms
  plot_and_save_histogram(gray_hist, "Grayscale Histogram", "Pixel Intensity",
                          "Frequency", "grayscale_histogram.png");
  plot_and_save_histogram(equ_hist, "Equalized Histogram", "Pixel Intensity",
                          "Frequency", "equalized_histogram.png");
  return 0;
}
執行結果:


a: 輸入。b: 輸出。

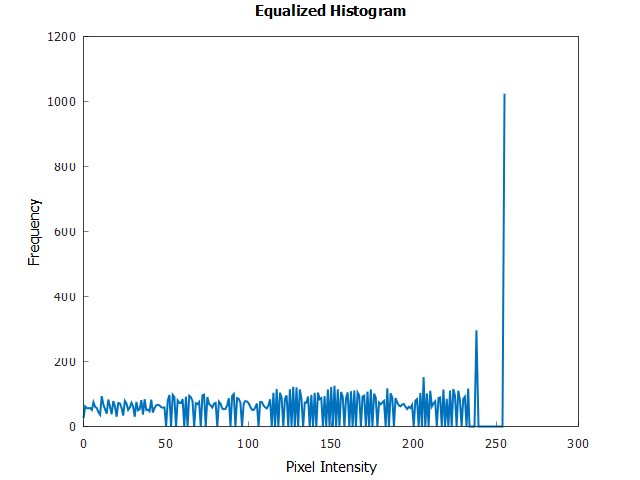
a: 輸入。b: 輸出。
equalizeHist()
用於灰階影像 (單一 channel) 的 histogram equalization。Histogram equalization 是一種調整影像強度,以增強 contrast (對比度) 的技術。
Histogram equalization 的主要用途是在影像預處理中,特別是在需要 standardize 多個影像的照明條件或增強 contrast,以更好地提取特徵的情況下。
void cv::equalizeHist(InputArray src,
					  OutputArray dst)
| 參數 | 說明 |
|---|---|
| src | 來源影像,應該是灰階影像 (8-bit)。 |
| dst | 輸出影像。 |
cv2.createCLAHE(),它將影像分割為 blocks 並對每個 block 應用 histogram equalization。這可以防止相對均勻區域中的 noise 過度放大。
Histogram equalization 可以與其他預處理技術結合使用 (例如: denoising、sharpening 等) ,以增強結果,特別是在複雜的影像處理任務中。
謹慎對待有大量 noise 的影像。Histogram equalization 可以增加 noise 的可見度。- Histogram
Histogram $H(i)$ 是一個函數,用於計算每個強度值 $i$ 在影像中出現的次數。 (範圍從 0 到 $L-1$,其中 $L$ 是可能的強度 levels 數量)
$$H(i) = \text{Number of pixels with intensity } i$$
- Cumulative Distribution Function (CDF)
$CDF(i)$ 對於強度 level $i$,是直到該強度的 histogram 值的累積和。在數學上,它表示為:
$$CDF(i) = \sum_{j=0}^{i} H(j)$$
這意味著對於每個強度等級 $i$,CDF 給出強度小於或等於 $i$ 的像素總數。
- Minimum CDF
$CDF_{\text{min}}$ 是 CDF 中最小的非零值。其計算公式為:
$$CDF_{\text{min}} = \min\{ CDF(i) \,|\, CDF(i) > 0 \}$$
該值用於避免在 normalization 步驟中出現零分母,並從影像中存在的最低強度開始 equalization (忽略具有零像素的強度)。
- 總像素數量
影像中的像素總數 $N$ 是 histogram 中所有值的總和,這也是 CDF 的最後一個值 (因為它是累積和)。這可以表示為:
$$N = CDF(L-1) = \sum_{i=0}^{L-1} H(i)$$
- Histogram Equalization
Equalized 影像中每個原始強度 $i$ 的新強度值 $H_{\text{eq}}(i)$ 的公式為:
$$H_{\text{eq}}(i) = \left( \frac{CDF(i) - CDF_{\text{min}}}{N - CDF_{\text{min}}} \right) \times (L - 1)$$
此公式將 CDF normalizes 為 $[0, L-1]$ 範圍 (對於 8-bit 影像,通常為 $L = 256$),從而將強度值分佈在整個範圍內,從而增強影像的對比度。
Example 1: Basic Usage
#include <iostream>
#include <opencv2/opencv.hpp>

int main() {
  // Define the paths for input and output images
  std::string inputPath = "dark night.jpg";
  std::string outputPathGray = "Gray Image.png";
  std::string outputPathEqualized = "Equalized Image.png";

  // Read the image in grayscale
  cv::Mat grayImage = cv::imread(inputPath, cv::IMREAD_GRAYSCALE);
  if (grayImage.empty()) {
    std::cerr << "Could not read the image: " << inputPath << std::endl;
    return 1;
  }

  // Apply histogram equalization
  cv::Mat equalizedImage;
  cv::equalizeHist(grayImage, equalizedImage);

  // Write the gray and equalized images
  cv::imwrite(outputPathGray, grayImage);
  cv::imwrite(outputPathEqualized, equalizedImage);

  return 0;
}
執行結果:


a: 原始影像。b: 輸入。c: 輸出。


a: 原始影像。b: 輸入。c: 輸出。
Example 2: 與彩色影像相結合
雖然 cv.equalizeHist 只適用於 grayscale 影像,但您可以將其應用於 HSV, YUV 或 CIELAB 等色彩空間中的 luminance channel ,然後再將其轉換回 RGB。
- 如果您的應用對人類感知色彩和亮度的方式很敏感,那麼 CIELAB 可能是最佳選擇,因為它具有感知均勻性。
- 如果應用對色彩和亮度的分離非常重要,而且任務高度依賴於色彩 (如基於色彩的物體跟蹤),則 HSV 更為可取。
- YUV 屬於中間值,在視訊處理和需要處理光照變化的應用中特別有用。
#include <opencv2/opencv.hpp>

int main() {
  // Read the image
  cv::Mat image = cv::imread("dark night.jpg");
  if (image.empty()) {
    std::cerr << "Could not read the image." << std::endl;
    return 1;
  }

  // Convert BGR to L*a*b*
  cv::Mat imageLab;
  cv::cvtColor(image, imageLab, cv::COLOR_BGR2Lab);

  // Split the Lab image into separate channels
  std::vector<cv::Mat> labChannels(3);
  cv::split(imageLab, labChannels);

  // Equalize the histogram of the L channel
  cv::equalizeHist(labChannels[0], labChannels[0]);

  // Merge the modified L channel back with the original a and b channels
  cv::merge(labChannels, imageLab);

  // Convert Lab back to BGR
  cv::Mat equalizedLabImage;
  cv::cvtColor(imageLab, equalizedLabImage, cv::COLOR_Lab2BGR);
  cv::imwrite("Equalized Color Image.png", equalizedLabImage);

  return 0;
}
執行結果:


a: 輸入。c: 輸出。


a: 輸入。c: 輸出。
Example 3: 與彩色影像相結合 (HSV)
#include <opencv2/opencv.hpp>

int main() {
  // Read the image
  cv::Mat image = cv::imread("dark night.jpg");
  if (image.empty()) {
    std::cerr << "Could not read the image." << std::endl;
    return 1;
  }

  // Convert BGR to HSV
  cv::Mat imageHSV;
  cv::cvtColor(image, imageHSV, cv::COLOR_BGR2HSV);

  // Split the HSV image into separate channels
  std::vector<cv::Mat> HSVChannels(3);
  cv::split(imageHSV, HSVChannels);

  // Equalize the histogram of the V channel
  cv::equalizeHist(HSVChannels[2], HSVChannels[2]);

  // Merge the modified V channel back with the original H and S channels
  cv::merge(HSVChannels, imageHSV);

  // Convert HSV back to BGR
  cv::Mat equalizedHSVImage;
  cv::cvtColor(imageHSV, equalizedHSVImage, cv::COLOR_HSV2BGR);
  cv::imwrite("Equalized Color Image.png", equalizedHSVImage);

  return 0;
}
執行結果:


a: 輸入。c: 輸出。


a: 輸入。c: 輸出。
createCLAHE()
Contrast Limited Adaptive Histogram Equalization. (CLAHE; 對比度有限自適應直方圖均衡) 它廣泛應用於醫學影像、衛星影像和攝影。
cv::Ptr<cv::CLAHE> cv::createCLAHE(double clipLimit = 40.0,
                                   Size tileGridSize = Size(8, 8))
| 參數 | 說明 |
|---|---|
| clipLimit | 設定 contrast 限制的閾值,通常在 1.0 到 4.0 的範圍。 較高的 clipLimit 值會增加一定程度的 contrast,但也會放大 noise。相反,較低的值將限制這種效果,但可能導致 contrast 增強不太明顯。 |
| tileGridSize | 指定影像將被劃分成的 grid 的大小。Histogram equalization 單獨應用於每個 grid tile (網格磚),從而實現局部對比增強。通常為 (8, 8) 或 (16, 16)。較小的 tiles 可以帶來更詳細的 contrast 增強,但它們也可能放大雜訊。較大的 tiles 提供更廣泛的增強。 |
CLAHE 可能需要大量計算,尤其是在 tile 尺寸較小且解析度較高的情況下。如果在 real-time 應用程式中使用 CLAHE,請務必考慮效能影響。
CLAHE 的最佳參數在很大程度上取決於應用。例如: 醫學成像可能需要與衛星影像或攝影不同的設定。- 劃分為 Tiles。
影像被分割為不重疊的 tiles,通常大小為 8x8 或 16x16 像素。
- Histogram 計算
對於每個 tile,計算其 histogram $H(i)$,其中 $i$ 範圍從 0 (黑色) 到$L-1$ (白色),$L$ 是影像中可能的強度等級的數量 (通常 8-bit 影像為 256)。
- Clip 限制和 Contrast 限制
定義 clip 限制 $C$ 來限制 contrast。這個想法是重新分配超過此限制的 histogram 條目。 Clip 限制通常是每個 bin 的平均像素數的函數,並透過使用者定義的 clip 係數進行調整。
如果對任何 $i$,$H(i) > C$,則多餘的 $H(i) - C$ 均勻地重新分配到所有 histogram bins。Iteratively 執行此過程,直到所有 bin 的值都小於或等於 $C$。這可以表示為:
$$H_{\text{clipped}}(i) = \min(H(i), C) + \frac{1}{L} \sum_{j=0}^{L-1} \max(H(j) - C, 0)$$
其中 $H_{\text{clipped}}(i)$ 是 contrast 限制後的 histogram。
- Histogram Equalization
對於每個 tile,Clipped histogram 用於計算 Cumulative Distribution Function (CDF),然後將其 normalized 以將 histogram 對應到影像的完整顯示範圍:
$$CDF(i) = \frac{\sum_{j=0}^{i} H_{\text{clipped}}(j)}{\sum_{j=0}^{L-1} H_{\text{clipped}}(j)}$$
然後透過此 normalized CDF 映射原始像素值來獲得新的像素值,從而有效地擴展強度範圍並提高對比度:
其中 $I_{x,y}$ 是位置 $(x,y)$ 處像素的原始強度,$I'_{x,y}$ 是均衡後的新強度。
- Bilinear Interpolation (雙線性插值)
為了避免人為地在 tiles 之間產生邊界,CLAHE 演算法在 tile borders,插入像素值。這涉及到使用四個最近的 tile corners 的均衡值並應用 bilinear interpolation:
其中 $a、b、c、$ 和 $d$ 是基於 $(x,y)$ 到 four corners 的距離的插值係數,$I''_{x,y}$ 是 $(x, y)$ 處的最終插值強度值。
Example 1: Basic Usage
#include <iostream>
#include <opencv2/opencv.hpp>

int main() {
  std::string path_to_image = "dark night.jpg";

  // Read the image
  cv::Mat image = cv::imread(path_to_image, cv::IMREAD_COLOR);
  if (image.empty()) {
    std::cerr << "Error: Unable to open image file." << std::endl;
    return 1;
  }
  cv::Mat image_gray;
  cv::cvtColor(image, image_gray, cv::COLOR_BGR2GRAY);

  // Create a CLAHE object
  cv::Ptr<cv::CLAHE> clahe = cv::createCLAHE(2.0, cv::Size(8, 8));

  // Apply CLAHE
  cv::Mat enhanced_img;
  clahe->apply(image_gray, enhanced_img);

  // Write the images
  cv::imwrite("Gray Image.png", image_gray);
  cv::imwrite("CLAHE Enhanced Image.png", enhanced_img);
  std::cout << "CLAHE enhanced image saved successfully." << std::endl;
  return 0;
}
執行結果:


a: 原始影像。b: 輸入。c: 輸出。


a: 原始影像。b: 輸入。c: 輸出。
Example 2: 處理彩色影像
彩色影像需要不同的方法,因為 CLAHE 通常應用於灰階影像。一種常見的方法是將影像轉換為 HSV 或 LAB 等色彩空間,將 CLAHE 應用於 luminance channel,然後轉換回 RGB。
#include <filesystem>
#include <iostream>
#include <opencv2/opencv.hpp>

int main() {
  std::string path_to_image = "dark night.jpg";

  // Read the image
  cv::Mat image = cv::imread(path_to_image);
  if (image.empty()) {
    std::cerr << "Error: Unable to open image file." << std::endl;
    return 1;
  }
  cv::Mat image_lab;
  cv::cvtColor(image, image_lab, cv::COLOR_BGR2Lab);

  // Split the LAB image to different channels
  std::vector<cv::Mat> lab_planes(3);
  cv::split(image_lab, lab_planes);

  // Apply CLAHE to the L-channel
  cv::Ptr<cv::CLAHE> clahe = cv::createCLAHE(3.0, cv::Size(8, 8));
  clahe->apply(lab_planes[0], lab_planes[0]);

  // Merge the LAB channels back
  cv::merge(lab_planes, image_lab);

  // Convert back to BGR color space
  cv::Mat equalized_lab_image;
  cv::cvtColor(image_lab, equalized_lab_image, cv::COLOR_Lab2BGR);
  cv::imwrite("CLAHE Enhanced Image.png", equalized_lab_image);
  std::cout << "CLAHE enhanced image saved successfully." << std::endl;

  return 0;
}
執行結果:


a: 輸入。b: 輸出。


a: 輸入。b: 輸出。
Example 3: 處理彩色影像 (HSV)
#include <filesystem>
#include <iostream>
#include <opencv2/opencv.hpp>

int main() {
  std::string path_to_image = "dark night.jpg";

  // Read the image
  cv::Mat image = cv::imread(path_to_image);
  if (image.empty()) {
    std::cerr << "Error: Unable to open image file." << std::endl;
    return 1;
  }
  cv::Mat image_hsv;
  cv::cvtColor(image, image_hsv, cv::COLOR_BGR2HSV);

  // Split the HSV image to different channels
  std::vector<cv::Mat> hsv_planes(3);
  cv::split(image_hsv, hsv_planes);

  // Apply CLAHE to the V-channel
  cv::Ptr<cv::CLAHE> clahe = cv::createCLAHE(3.0, cv::Size(8, 8));
  clahe->apply(hsv_planes[2], hsv_planes[2]);

  // Merge the HSV channels back
  cv::merge(hsv_planes, image_hsv);

  // Convert back to BGR color space
  cv::Mat equalized_hsv_image;
  cv::cvtColor(image_hsv, equalized_hsv_image, cv::COLOR_HSV2BGR);
  cv::imwrite("CLAHE Enhanced Image.png", equalized_hsv_image);
  std::cout << "CLAHE enhanced image saved successfully." << std::endl;

  return 0;
}
執行結果:


a: 輸入。b: 輸出。


a: 輸入。b: 輸出。
Member Function
將 CLAHE 演算法應用於輸入影像。輸入通常是 grayscale 影像。
virtual void cv::CLAHE::apply(InputArray src, OutputArray dst)
設定 CLAHE 演算法的 contrast 限制的閾值。
virtual void cv::CLAHE::setClipLimit(double clipLimit)
設定演算法中所使用的 tiles 的 grid 大小。
virtual void cv::CLAHE::setTilesGridSize(Size tileGridSize)
返回 CLAHE 演算法當前使用的 clip 限制。
virtual Size cv::CLAHE::getTilesGridSize() const
返回基於 tile 的 contrast 增強的 grid 大小。
virtual double cv::CLAHE::getClipLimit() const
Example 1: Basic Usage
#include <iostream>
#include <opencv2/opencv.hpp>

int main() {
  std::string imagePath = "dark night.jpg";

  // Read the image
  cv::Mat image = cv::imread(std::string(imagePath), cv::IMREAD_COLOR);
  if (image.empty()) {
    std::cerr << "Could not read the image: " << imagePath << std::endl;
    return 1;
  }
  cv::Mat image_gray;
  cv::cvtColor(image, image_gray, cv::COLOR_BGR2GRAY);

  // Create a CLAHE object
  cv::Ptr<cv::CLAHE> clahe = cv::createCLAHE(2.0, cv::Size(8, 8));

  // Set a new clip limit and grid size
  clahe->setClipLimit(10.0);
  clahe->setTilesGridSize(cv::Size(10, 10));

  // Apply CLAHE
  cv::Mat enhanced_img;
  clahe->apply(image_gray, enhanced_img);
  cv::imwrite("Gray Image.png", image_gray);
  cv::imwrite("CLAHE Enhanced Image.png", enhanced_img);

  // Get the current clip limit and tile grid size
  double clip_limit = clahe->getClipLimit();
  cv::Size grid_size = clahe->getTilesGridSize();

  std::cout << "Current Clip Limit: " << clip_limit
            << std::endl;  // Output: 10.0
  std::cout << "Current Tile Grid Size: (" << grid_size.width << ", "
            << grid_size.height << ")" << std::endl;  // Output: (10, 10)

  return 0;
}
執行結果:


a: 輸入。b: 輸出。
參考資料
OpenCV: cv::CLAHE Class Reference

