calcBackProject()
用於 back projection (反向投影)。
Back projection 的基本概念是使用目標物體的特徵 (例如: color) 的 histogram,然後使用該 histogram 在另一個影像中尋找該物體。 透過使用這種方法,可以根據物體的亮度和顏色資訊將物體從背景中分離出來,因此透過將其應用於影片的每一幀,可以用於物體檢測和物體追蹤。
calcBackProject(images,
                channels,
                hist,
                ranges,
scale) ->dst| 參數 | 說明 |
|---|---|
| images | 要套用 back projection 影像。 |
| channels | 一個 list of indices,其中每個 index 指定用於從給定的影像,進行 back projection 的 channel。 |
| hist | 想要 back project 的 histogram,它代表您想要在 images 中偵測的 feature。該 histogram 應是先使用 ccalcHist() 計算。 |
| ranges | 每個 channel 值的範圍。例如: 對於 HSV 影像,這通常是 [0, 256] 或 [0, 180] 。 |
| scale | 縮放係數。預設情況下,它設定為 1。該係數在返回之前,與 back-projected histogram 相乘。 |
令 $I(x, y)$ 為輸入影像中座標 $(x, y)$ 處的像素值,令 $H(v)$ 為像素值 $v$ 的 normalized histogram 值。反投影影像 $B(x, y)$ 可以計算為:
$$B(x, y) = H(I(x, y))$$
其中:
- $I(x, y)$: 輸入影像在位置 $(x, y)$ 的像素值。
- $H(v)$: 像素值 $v$ 的 normalized histogram value。
- $B(x, y)$: 位置 $(x, y)$ 處的反投影影像的值。
反投影的步驟:
- 計算 Histogram: 計算參考影像的 histogram $H$。
- Normalize the Histogram。
- Backproject the Histogram:對於輸入影像中的每個像素 $I(x, y)$,找出對應的 histogram value $H(I(x, y))$。將此 histogram value 指派給反投影影像 $B(x, y)$ 中的對應像素。
其原理涉及使用參考影像中的特徵的 histogram,對其進行 normalizing,然後將該 histogram 投影到目標影像上,以識別相似區域。數學基礎很簡單,涉及目標影像中,每個像素的 histogram 查找和賦值。
Example1: Basic Usage
import cv2
import numpy as np
from matplotlib import pyplot as plt
from typing import Tuple

def extract_roi(image: np.ndarray, roi: Tuple[int, int, int, int]) -> np.ndarray:
    """Extract a region of interest from the image."""
    x_start, y_start, x_end, y_end = roi
    return image[y_start:y_end, x_start:x_end]

def annotate_image(image: np.ndarray, rois: list) -> np.ndarray:
    """Draw rectangles around regions of interest on the image."""
    annotated_image = image.copy()
    for roi in rois:
        cv2.rectangle(annotated_image, (roi[0], roi[1]), (roi[2], roi[3]), (255, 0, 255), 2, cv2.LINE_AA)
    return annotated_image

def calculate_histograms(rois: list) -> np.ndarray:
    """Calculate and accumulate multi-dimensional histograms for each ROI."""
    cumulative_hist = np.zeros([180, 256], dtype="float32")
    for roi in rois:
        hist_roi = cv2.calcHist([roi], [0, 1], None, [180, 256], [0, 180, 0, 256], hist=cumulative_hist, accumulate=True)
    return cumulative_hist

def apply_convolution(image: np.ndarray, kernel: np.ndarray) -> np.ndarray:
    """Apply convolution to the image using the given kernel."""
    return cv2.filter2D(image, -1, kernel, image)

def main():
    # Load and process the image
    image = cv2.imread('baseball field.jpg')
    hsv_image = cv2.cvtColor(image, cv2.COLOR_BGR2HSV)
    rgb_image = cv2.cvtColor(image, cv2.COLOR_BGR2RGB)

    # Define regions of interest (ROIs) (x1, y1, x2, y2)
    rois = [(15, 514, 136, 612),
            (388, 663, 505, 715),
            (933, 711, 1061, 805)]
    roi_images = [extract_roi(hsv_image, roi) for roi in rois]

    # Annotate and save the image with ROIs
    annotated_image = annotate_image(image, rois)
    cv2.imwrite("Annotated.png", annotated_image)

    # Calculate histograms for ROIs
    cumulative_hist = calculate_histograms(roi_images)

    # Histogram back projection
    cv2.normalize(cumulative_hist, cumulative_hist, 0, 255, cv2.NORM_MINMAX)
    back_proj = cv2.calcBackProject([hsv_image], [0, 1], cumulative_hist, [0, 180, 0, 256], 1)
    cv2.imwrite('Back Project.png', back_proj)

    # Improve accuracy with convolution
    # Processing twice, the filter effect will be stronger and accuracy can be expected to improve.
    kernel = cv2.getStructuringElement(cv2.MORPH_ELLIPSE, (3, 3))
    back_proj = cv2.filter2D(back_proj, -1, kernel, back_proj)
    back_proj = cv2.filter2D(back_proj, -1, kernel, back_proj)
    cv2.imwrite('Back Project with convolution.png', back_proj)

    # Thresholding to segment the detected regions
    _, thresh = cv2.threshold(back_proj, 5, 255, 0)
    cv2.imwrite('Threshold image.png', thresh)

    merged_thresh = cv2.merge((thresh, thresh, thresh))
    result = cv2.bitwise_and(rgb_image, merged_thresh)
    cv2.imwrite('Back Project Result image.png', result)


if __name__ == "__main__":
    main()
執行結果:

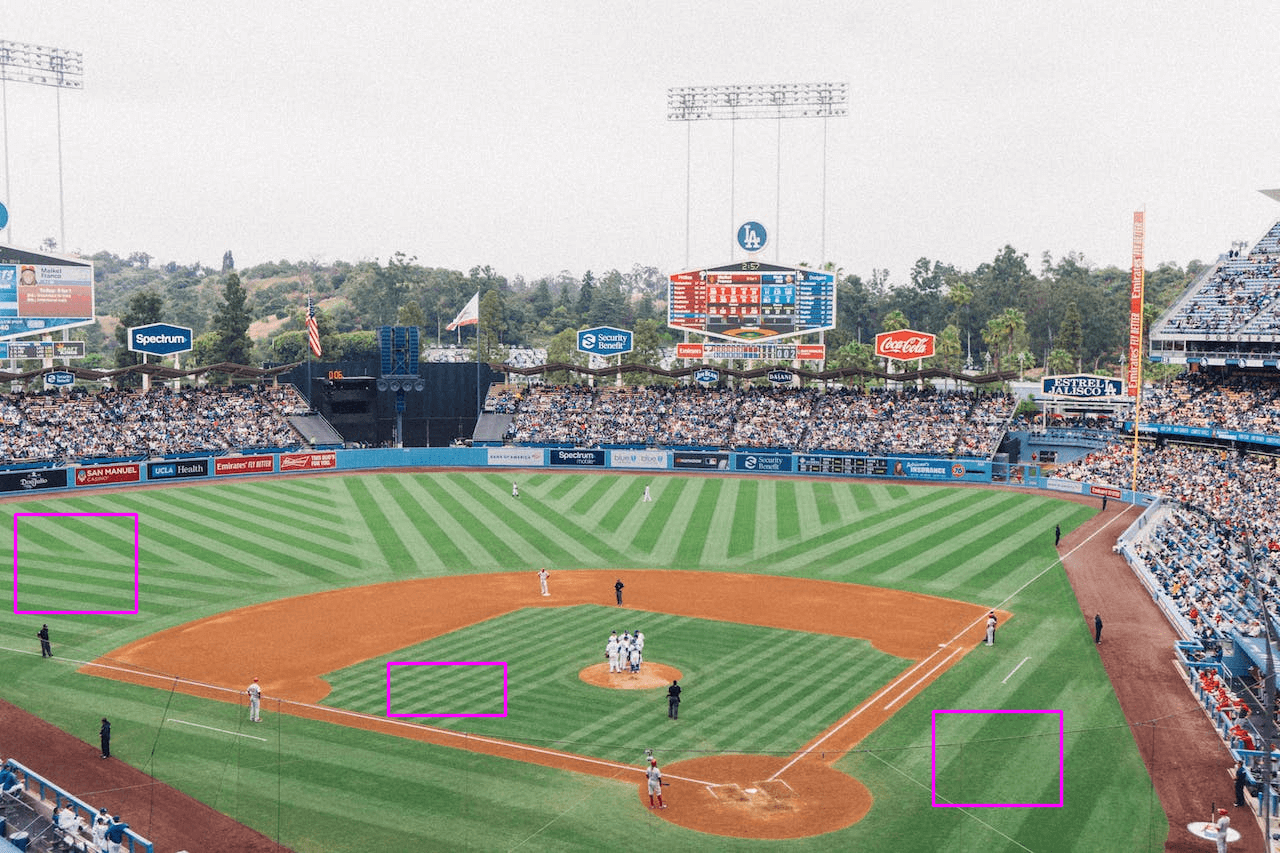
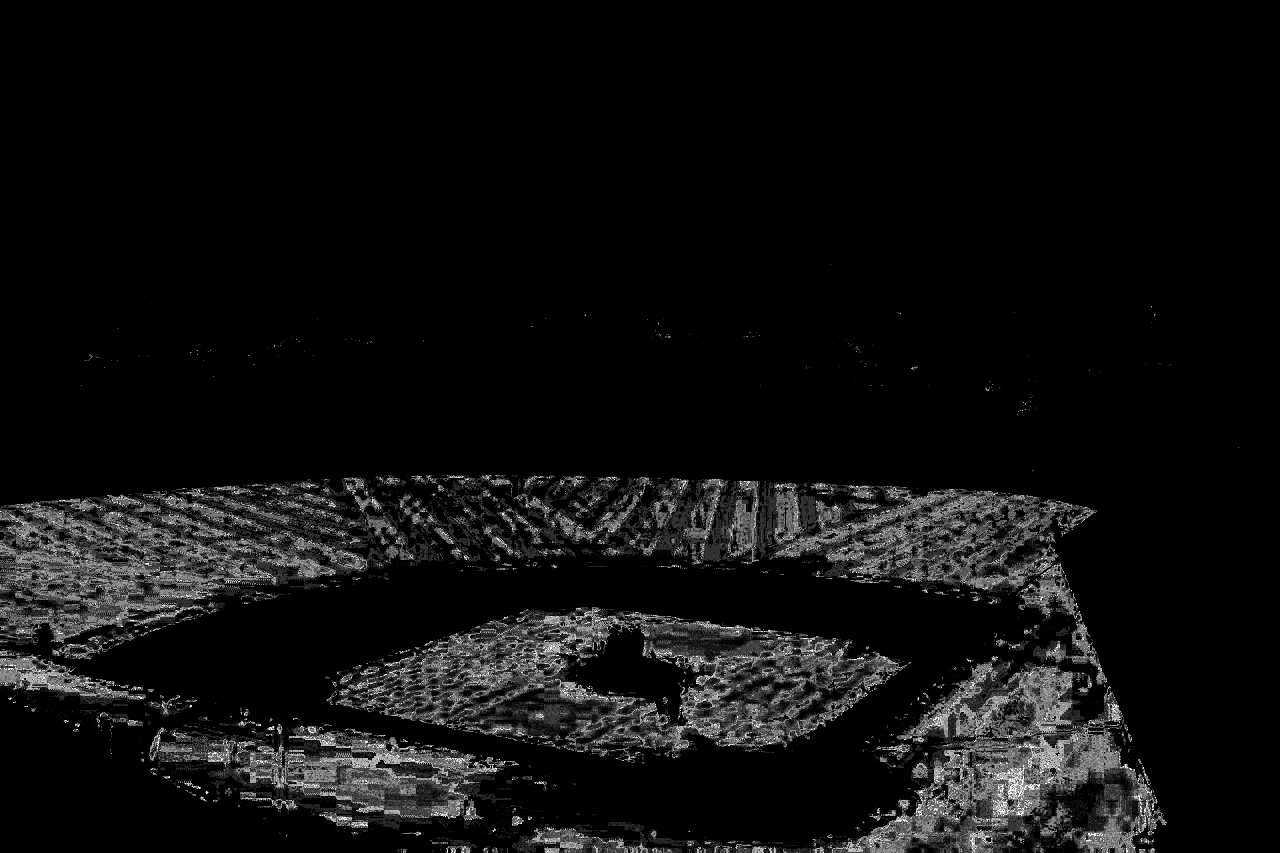
a: 輸入。b: Regions of interest。c: Back Project
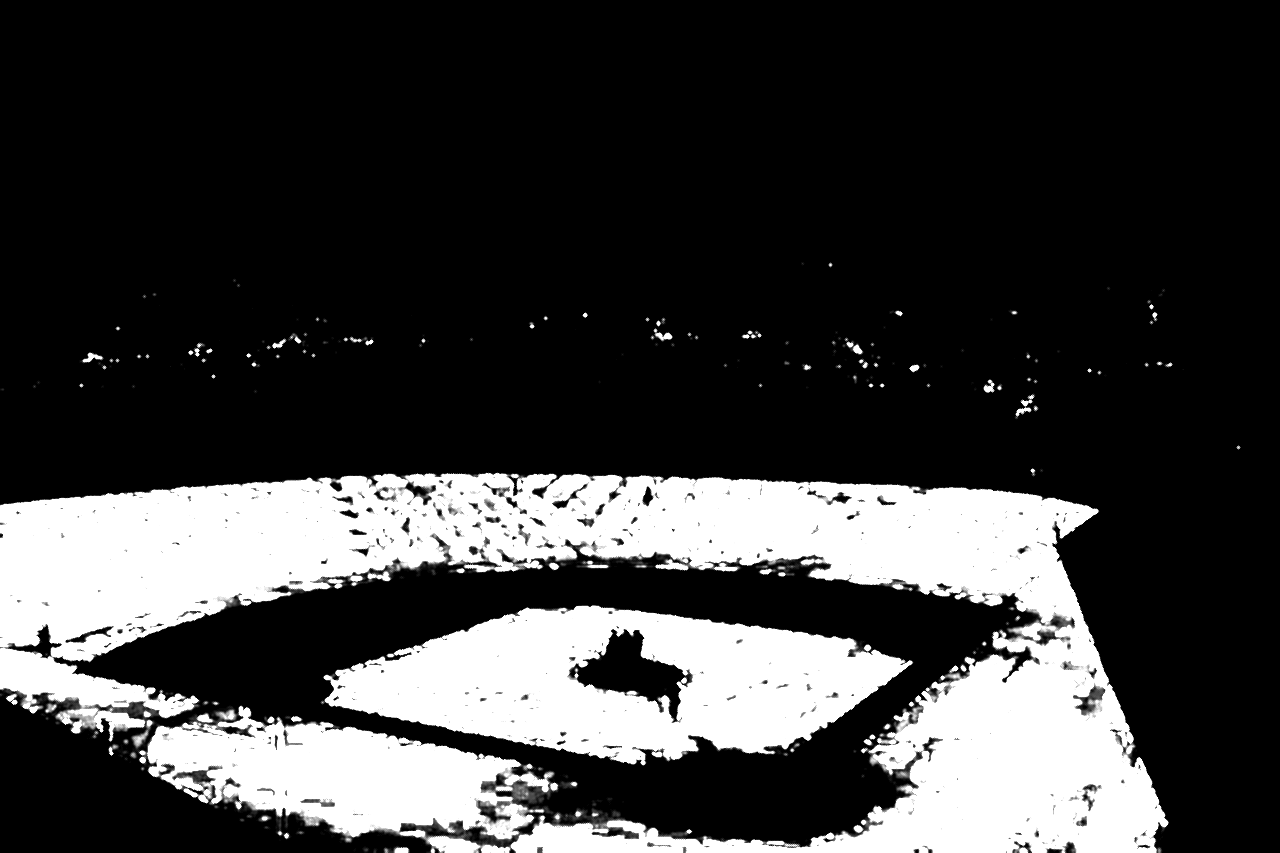
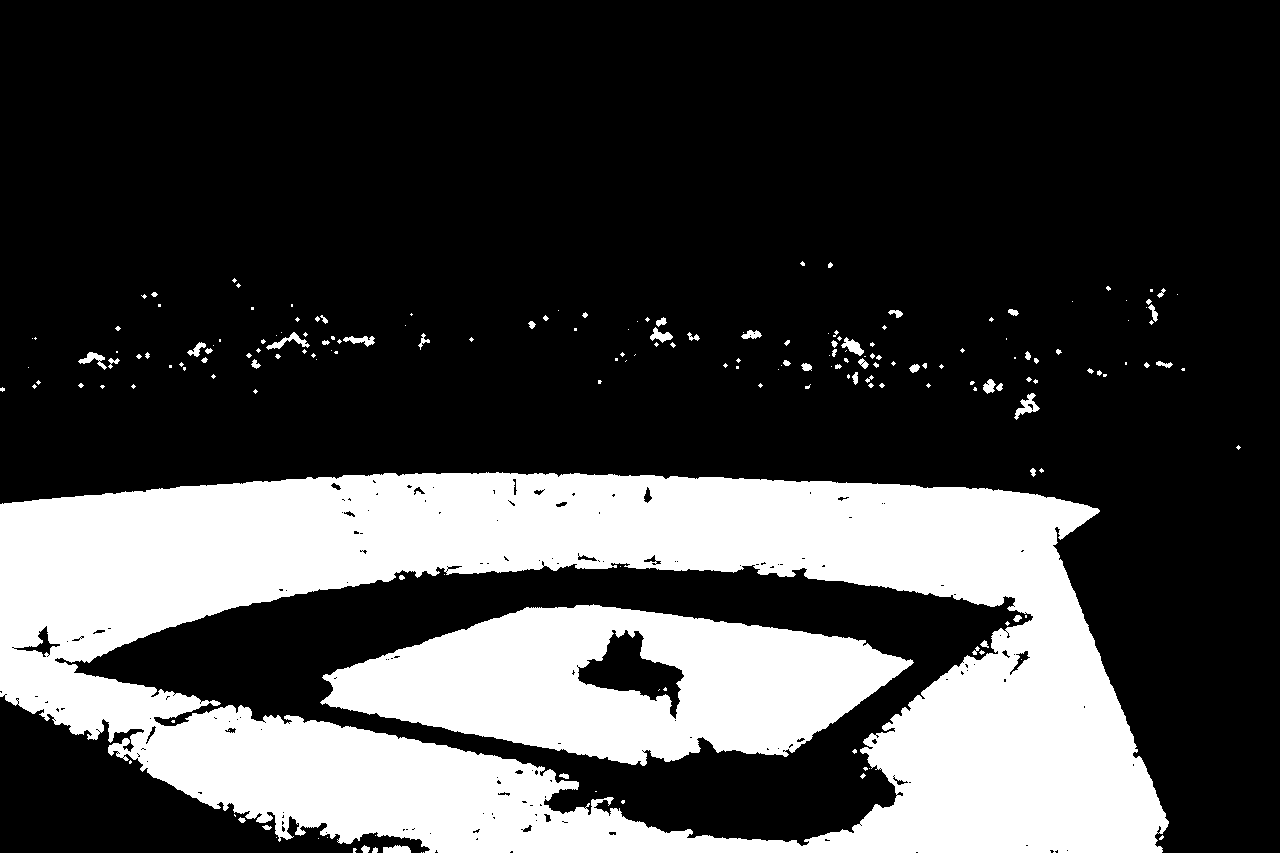
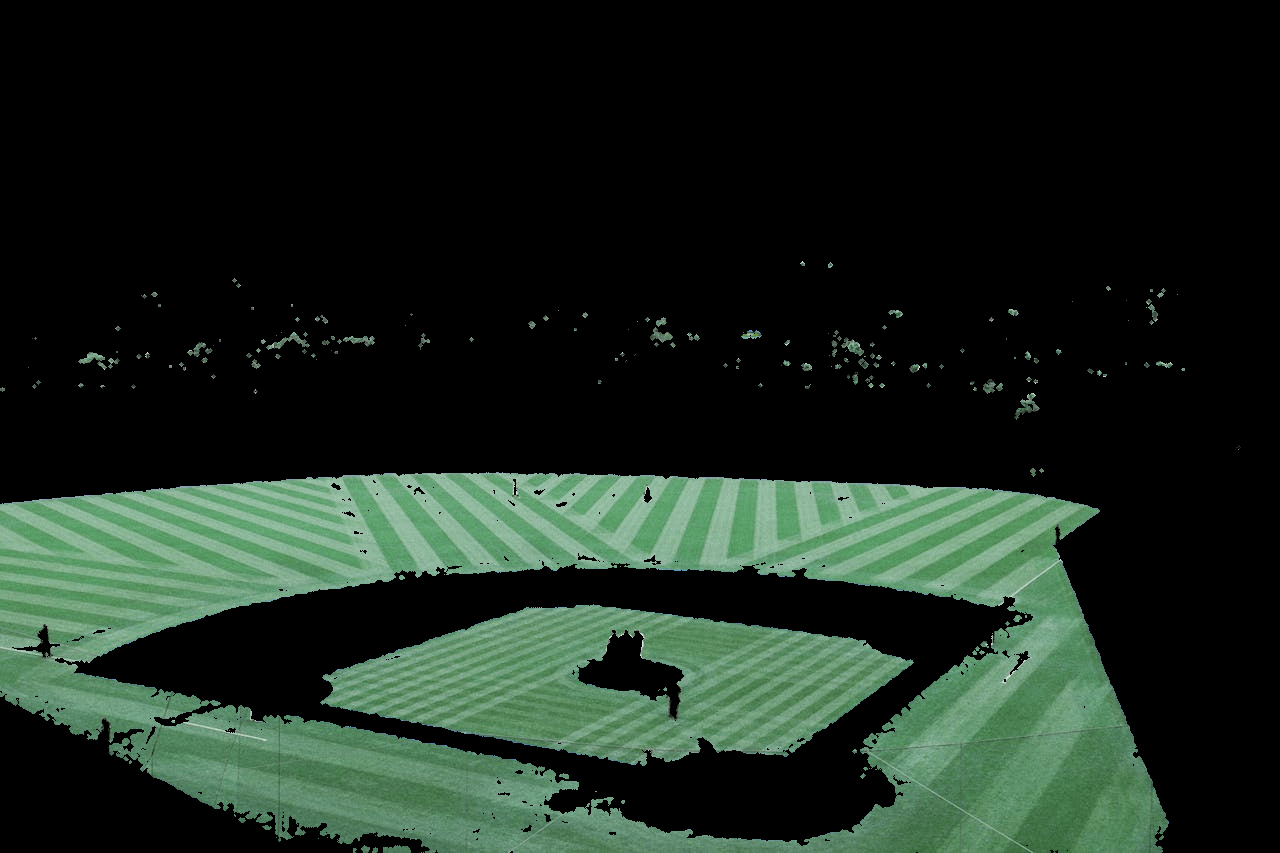
a: Back Project with Convolution。b: Threshold 影像。c: Back Project Result
Example 2: 演示工作原理
讓我們建立一個簡單的 5x5 影像,其值範圍為 0 到 4。為簡單起見,我們只考慮強度 (灰階值)。bins 的範圍是從 0 到 5。
import numpy as np
import cv2 as cv

# Step 1: Create a small target image and a ROI
target_image = np.array([
    [0, 1, 2, 3, 4],
    [1, 2, 3, 4, 0],
    [2, 3, 4, 0, 1],
    [3, 4, 0, 1, 2],
    [4, 0, 1, 2, 3]
], dtype=np.uint8)

# And a smaller ROI (2x2)
roi = np.array([
    [2, 3],
    [3, 4]
], dtype=np.uint8)

# Step 2: Calculate the histogram of the ROI
# For simplicity, we consider only the intensity (grayscale values)
# Here, bins range from 0 to 5 to cover all values from 0 to 4
roi_hist = cv.calcHist([roi], [0], None, [5], [0, 5])
print(roi_hist)      # ROI Histogram

# Normalize the histogram
cv.normalize(roi_hist, roi_hist, 0, 255, cv.NORM_MINMAX)

# Step 3: Use BackProject
back_project = cv.calcBackProject([target_image], [0], roi_hist, [0, 5], 1)

print(target_image)  # Original Target Image
print(roi_hist)      # ROI Histogram
print(back_project)  # Back Projection Result
執行結果:
# Original Target Image
[[0 1 2 3 4]
 [1 2 3 4 0]
 [2 3 4 0 1]
 [3 4 0 1 2]
 [4 0 1 2 3]]

# ROI Histogram
[[0.]
 [0.]
 [1.]
 [2.]
 [1.]]

# Normalize the histogram
[[  0. ]
 [  0. ]
 [127.5]
 [255. ]
 [127.5]]

# Back Projection Result
[[  0   0 128 255 128]
 [  0 128 255 128   0]
 [128 255 128   0   0]
 [255 128   0   0 128]
 [128   0   0 128 255]]
compareHist()
用於比較兩個影像的 histograms。Histograms 表示影像中像素強度 (顏色) 的分佈,比較它們對於影像檢索、物體辨識和紋理分類等各種任務很有用。
compareHist(H1, H2, method) -> retval
| 參數 | 說明 |
|---|---|
| H1 | 要比較的第一個 histograms。 |
| H2 | 與 H1 進行比較的第二個 histograms。這應該是與 H1 具有一致的格式和大小的多維 array。比較將分析這個 histogram 與 H1 有多麼相似或不同。 |
| method | 指定比較的方法。 OpenCV 提供了多種方法,每種方法適用於不同的場景。方法的選擇可以顯著影響比較的結果。 |
在比較 histogram 之前,預處理影像通常是有益的。例如:
- Grayscale 轉換:特別是對於紋理或形狀比較,將影像轉換為灰階可以降低複雜性。
- Normalization:Normalizing the histograms 可以使比較更加 robust,尤其是在不同的照明條件下。
- Blur:應用 Blur (模糊),可以減少影像中的雜訊和微小變化。例如: 高斯模糊
calcHist() 的 mask 來關注這些區域。
Example 1: Basic Usage
import cv2
import numpy as np

# Load two images
image = cv2.imread('coffee.png')
gray_image = cv2.cvtColor(image, cv2.COLOR_BGR2GRAY)
equ_image = cv2.equalizeHist(gray_image)

# Calculate histograms
hist1 = cv2.calcHist([gray_image], [0], None, [256], [0, 256])
hist2 = cv2.calcHist([equ_image], [0], None, [256], [0, 256])

# Compare histograms
result = cv2.compareHist(hist1, hist2, cv2.HISTCMP_CORREL)
print("Similarity: ", result)  # Output: 0.18

result = cv2.compareHist(hist1, hist2, cv2.HISTCMP_CHISQR)
print("Similarity: ", result)  # Output: 7390.33

result = cv2.compareHist(hist1, hist2, cv2.HISTCMP_INTERSECT)
print("Similarity: ", result)  # Output: 32.79

result = cv2.compareHist(hist1, hist2, cv2.HISTCMP_BHATTACHARYYA)
print("Similarity: ", result)  # Output: 0.43

result = cv2.compareHist(hist1, hist2, cv2.HISTCMP_CHISQR_ALT)
print("Similarity: ", result)  # Output: 42.66

result = cv2.compareHist(hist1, hist2, cv2.HISTCMP_KL_DIV)
print("Similarity: ", result)  # Output: 236.97

cv2.imwrite('gray_image.png', gray_image)
cv2.imwrite('equ_image.png', equ_image)
執行結果:
Similarity:  0.18995721118151654
Similarity:  7390.331608044148
Similarity:  32.79401049713124
Similarity:  0.4374292584304278
Similarity:  42.668487276420336
Similarity:  236.97423912500204


a: 原始影像。b: 輸入 1。c: 輸入 2。
EMD()
Earth Mover's Distance (EMD) 函數。 EMD 是空間區域上兩個機率分佈之間距離的度量,通常用於影像處理和電腦視覺來比較影像的各種特徵,例如: 顏色分佈或紋理。EMD 值可以反映兩個影像的相似程度,數值越低表示相似度越高。
Earth Mover's Distance ,也稱為 Wasserstein distance,是多維空間中距離測量的一種形式。可以直觀地理解為將一種分佈轉換為另一種分佈所需的最小 "工作" 量,其中 "工作" 被量化為必須移動的分佈權重的量乘以必須移動的距離。
該函數採用兩個 feature sets (通常是 histograms 或影像的簽名表示) 並計算它們之間的 EMD。分佈的簽名預計採用特定格式:浮點矩陣,每一個 row 代表一個 feature (在影像的情況下,這可能是具有相應權重的顏色)。第一個 column 應包含 feature 的權重,後續列應包含 feature 的維度 (例如: 不同通道中的顏色強度)。
cv2.EMD 的輸出有三個值。第一個是兩個 signatures 之間的 distance,第二個是 None,第三個是 flow matrix,告訴您什麼移動到了哪裡。
EMD(signature1,
	signature2,
	distType) -> cost, lowerBound, flow
| 參數 | 說明 |
|---|---|
| signature1 | 要比較的第一個 distribution or signature。signature 是一個 collection of features,其中每個 feature 由其權重及其在多維空間中的位置來描述。 這應該是一個浮點 matrix,其中每一行 (row) 代表一個 feature。第一列 (column) 是 feature 的權重,後續列表示 feature 的維度 (例如: 影像 histogram 的不同 channels 中的顏色強度)。 |
| signature2 | 要比較的第二個 distribution or signature。與 signature1 類似。 |
| distType | 比較 signatures 中的 features 時,要使用的 distance metric。 例如: cv.DIST_L1、cv.DIST_L2或 OpenCV 支援的任何其他距離類型。 cv.DIST_L2 對應於常用的 Euclidean distance。 |
| cost | Cost matrix ,定義 signature1 和 signature2 的 each pair of features 之間的距離。這是一個浮點 matrix,其中第 i 行第 j 列的元素表示將 signature1 的第 i 個特徵移到 signature2 的第 j 個 feature 的 cost (or distance)。當預設 distance metrics 不能滿足您的要求時,它非常有用。 |
| lowerBound | 用於指定計算距離的下限。如果發現實際 EMD 低於此界限,則函數將不會執行完整計算,而是返回此下限。 它可用於最佳化計算,特別是在不需要精確的 EMD 值,且下限足以用於比較目的的情況下。 |
| flow | 返回解決 transportation problem 所產生的 flow matrix。 |
cv.EMD 實現的 Earth Mover's Distance (EMD) 的數學公式,源自於 optimal transport 理論。 EMD 測量將一種分佈轉換為另一種分佈所需的最小 work,其中 work 定義為移動的 "mass" 乘以移動的距離。
給定兩個離散分佈, $P = {(p_1, w_{p_1}), \ldots, (p_m, w_{p_m})}$ 和 $Q = {(q_1, w_{q_1}), \ldots , (q_n, w_{q_n})}$,其中 $p_i$ 和 $q_j$ 是度量空間中的點,$w_{p_i}$, $w_{q_j}$ 是對應的權重 (masses), EMD 被定義為以下最佳化問題的解:
$$\text{EMD}(P, Q) = \min_{\mathbf{F}} \sum_{i=1}^{m} \sum_{j=1}^{n} f_{ij} \cdot d(p_i, q_j)$$
限制:
$$\sum_{j=1}^{n} f_{ij} \leq w_{p_i}, \quad \forall i \in {1, \ldots, m}$$
$$\sum_{i=1}^{m} f_{ij} \leq w_{q_j}, \quad \forall j \in {1, \ldots, n}$$
$$\sum_{i=1}^{m} \sum_{j=1}^{n} f_{ij} = \min \left( \sum_{i=1}^{m} w_{p_i}, \sum_{j=1}^{n} w_{q_j} \right)$$
$$f_{ij} \geq 0, \quad \forall i \in {1, \ldots, m}, \forall j \in {1, \ldots, n}$$
其中:
- $f_{ij}$ 表示從 $p_i$ 到 $q_j$ 的 flow,表示 $p_i$ 處的 mass 有多少應該移動到 $q_j$。
- $d(p_i, q_j)$ 是 $p_i$ 和 $q_j$ 之間的地面距離,可以是任何 metric 距離,例如: L1 distace, L2 distace等。
- 第一組限制確保任何 $p_i$ 流出的總 flow 不超過其可用 mass $w_{p_i}$。
- 第二組限制確保流入任何 $q_j$ 的總 flow 不超過其容量 $w_{q_j}$。
- 第三個限制確保總 flow (即移動的 mass) 等於 $P$ 中可用的總 mass 和 $Q$ 中的總容量中的較小者。
- 第四個限制條件確保所有 flow 值都是非負的。
解決這個最佳化問題給出了將分佈 $P$ 轉換為分佈 $Q$ 所需的最小 work,即兩個分佈之間的 Earth Mover's Distance。實際上,這涉及到考慮點之間的距離和 mass 移動的約束,找到最小化移動 mass 總 cost 的最佳 flow $f_{ij}$。這就需要在考慮各點之間的距離和品質移動限制的情況下,找到能使 mass 移動總 cost 最小的最佳 flow $f_{ij}$。
這種最佳化問題通常使用線性程式技術來解決,OpenCV 中的 cv.EMD 函數 abstracts 了這些細節,提供了一個 user-friendly interface 來計算兩個 weighted sets 之間的 EMD。
Example 1: Basic Usage
import numpy as np
import cv2 as cv

# Define two simple signatures for demonstration
signature1 = np.float32([[0.4, 100, 40],
                         [0.3, 200, 50],
                         [0.3, 255, 255]])
signature2 = np.float32([[0.5, 50, 100],
                         [0.35, 150, 200],
                         [0.15, 255, 255]])

# Calculate EMD and obtain the flow matrix
distance, _, flow = cv.EMD(signature1, signature2, cv.DIST_L2)

print(distance)
print(_)
print(flow)
執行結果:
[[0. 0. 0.]
 [0. 0. 0.]
 [0. 0. 0.]]

96.45507049560547
None
[[0.4        0.         0.        ]
 [0.09999999 0.20000002 0.        ]
 [0.         0.15       0.15      ]]
Example 2: Basic Usage
import cv2
import numpy as np
import matplotlib.pyplot as plt

def img_to_sig(arr):
    """
    Convert a 2D array to a signature for EMD.

    Parameters:
    - arr: A 2D numpy array where each element represents some quantity at that point.

    Returns:
    - A numpy array of shape (N, 3), where N is the number of non-zero elements in `arr`.
      Each row consists of [value, x-coordinate, y-coordinate].
    """
    # Ensure arr is a float32 array for compatibility with cv2.EMD
    arr = arr.astype(np.float32)

    # Indices and values of non-zero elements
    x, y = np.nonzero(arr)
    values = arr[x, y].flatten()

    # Combine values and coordinates
    sig = np.vstack((values, x, y), dtype=np.float32).T
    return sig

arr1 = np.array([[2, 0, 0],
                 [2, 0, 0],
                 [0, 0, 2]])

arr2 = np.array([[0, 1, 1],
                 [2, 0, 0],
                 [0, 2, 0]])

sig1 = img_to_sig(arr1)
sig2 = img_to_sig(arr2)
print(sig1)
print(sig2)

# Compute EMD
dist, _, flow = cv2.EMD(sig1, sig2, cv2.DIST_L2)
print(dist)
print(_)
print(flow)
執行結果:
[[2. 0. 0.]
 [2. 1. 0.]
 [2. 2. 2.]]

[[1. 0. 1.]
 [1. 0. 2.]
 [2. 1. 0.]
 [2. 2. 1.]]

0.8333333134651184
None
[[1. 1. 0. 0.]
 [0. 0. 2. 0.]
 [0. 0. 0. 2.]]
Example 3: 將影像色彩 Histograms 與 EMD 進行比較
影像的每個 channel 計算一個顏色 histogram ,並使用這些 histograms 建立 signatures。Histogram 的每個 bin 都成為 signature 中的一個 feature,其權重是 normalized 的 bin 計數。
新增 signature 中的虛擬維度 ([hist_value, bin_value, 0] 中的 0) 是為了與 EMD() 期望的 signature 格式相容,每個特徵至少需要兩個維度。
您可能需要根據您的特定要求調整 bins 參數。更多的箱子提供了更詳細的 histogram,但增加了計算時間和複雜性。
import cv2 as cv
import numpy as np

def compute_signature(image, bins=8):
    """
    Compute a color histogram signature for an image.

    This function calculates the histogram for each color channel in the image,
    concatenates these histograms into a single feature vector, and then
    normalizes this vector so that its components sum to 1. Each element of the
    signature represents the weight of the bin and its average value, along with
    a dummy value for compatibility with certain OpenCV functions.

    Parameters:
    - image: Input image in any color space, but typically in HSV or RGB.
    - bins: The number of bins to use for the histogram of each channel. Defaults to 8.

    Returns:
    - signature: A numpy array of shape (N, 3) where N is the number of bins times
        the number of channels. Each row contains the weight of the bin, the average
        bin value (for visualization purposes), and a dummy zero value.
    """
    # Compute histogram for each channel and concatenate them
    channels = cv.split(image)
    histogram = [cv.calcHist([channel], [0], None, [bins], [0, 256]) for channel in channels]
    histogram = np.concatenate(histogram).flatten()

    # Normalize histogram to sum to 1
    histogram /= histogram.sum()

    # Create signature: each feature is a bin value and its corresponding weight
    # Weight, BinValue, 0 (dummy dimension for compatibility)
    signature = np.zeros((len(histogram), 3), dtype=np.float32)
    for i, hist_value in enumerate(histogram):

        # Average bin value for visualization
        # Calculate the average value for the current bin for better representation
        bin_value = (i % bins) * 256 / bins + 256 / (2 * bins)

        # Weight, BinValue, Dummy
        signature[i] = [hist_value, bin_value, 0]

    return signature


image1 = cv.imread('dark night.jpg')

# Convert images to a desired color space if necessary, e.g., RGB to HSV
image1 = cv.cvtColor(image1, cv.COLOR_BGR2HSV)
image2 = cv.cvtColor(image1, cv.COLOR_BGR2HSV)

# Equalize the histogram of the V channel
image2[:, :, 2] = cv.equalizeHist(image2[:, :, 2])

# Compute signatures for each image
signature1 = compute_signature(image1)
signature2 = compute_signature(image2)

# Calculate EMD
distance, _, flow = cv.EMD(signature1, signature2, cv.DIST_L2)

print(f"EMD Distance: {distance}")
執行結果:
58.304145


a: 輸入 1。b: 輸入 2。
參考資料
OpenCV: cv::CLAHE Class Reference

