calcHist()
用於計算影像或影像 feature 的 histogram (直方圖)。Histogram 是影像中像素強度 (或任何其他影像屬性)分佈的圖形表示。
calcHist(images,
    	 channels,
    	 mask,
    	 histSize,
    	 ranges,
    	 hist = None,
    	 accumulate = False) ->hist
| 參數 | 說明 |
|---|---|
| images | 來源影像,應採用 Python list 的格式 (即 [img])。 |
| channels | 這是一個 list of indices,每個 index 指定要測量的 channel。 對於灰度影像, channels=[0];對於彩色影像,可以透過 [0]、[1] 或 [2],分別計算藍色、綠色或紅色 channels 的 histogram。 |
| mask | 遮罩影像。要考慮完整影像,請使用 None。要計算影像特定區域的直方圖,請提供與輸入影像大小相同的光罩影像,其中感興趣的區域為白色,其餘為黑色。您可以計算影像特定部分的直方圖,這在物件追蹤和辨識中特別有用。 |
| histSize | BIN 計數。對於全尺寸,請使用 [256]。太少的 bins 可能會使直方圖過於簡化,而太多的分箱可能會過於複雜。 |
| ranges | 想要測量的強度值的範圍。通常它是 [0, 256] (對於每個通道)。 |
| hist | 一個 array 或 sparse matrix (稀疏矩陣)。如果提供,函數將使用計算後的值填充 hist。確保預先分配的 histogram 具有正確的資料類型和大小。通常,使用 float32。 |
| accumulate | 如果該 flag 設為 True,則 histogram 一開始不會被清除。如果它設定為 False,則 histogram 在開始時被清除。 |
hist 參數可以更有效率。
accumulate 參數這對於隨著時間的推移或跨影像的各個區域,累積一系列直方圖,很有用。
Example1: 灰度影像
import cv2
import numpy as np
from matplotlib import pyplot as plt

img = cv2.imread('sakura.png')
gray = cv2.cvtColor(img, cv2.COLOR_BGR2GRAY)

hist = cv2.calcHist([img], [0], None, [256], [0, 256])
print(np.sum(hist))  # Output: 2557400.0

plt.plot(hist)
plt.title('Grayscale Histogram')
plt.savefig("Grayscale Histogram.png", bbox_inches='tight', dpi=150)
plt.show()
執行結果:

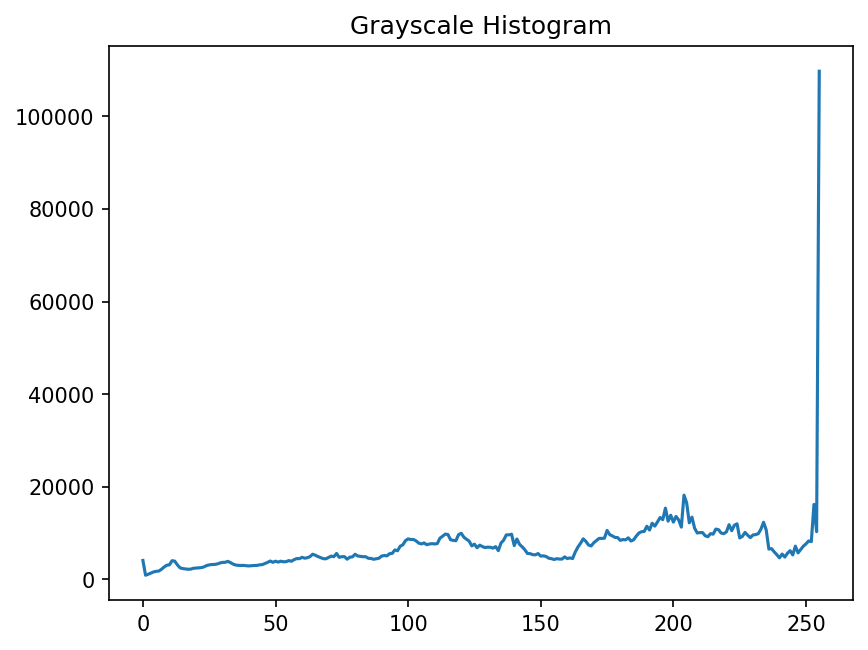
a: 輸入。b: 輸出。
Example 2: 彩色影像
import cv2
import numpy as np
from matplotlib import pyplot as plt

img = cv2.imread('sakura.png')
color = ('b', 'g', 'r')

for i, col in enumerate(color):
	hist = cv2.calcHist([img], [i], None, [256], [0, 256])
	plt.plot(hist, color = col)
	plt.xlim([0, 256])

plt.title('Color Histogram')
plt.savefig("Color Histogram.png", bbox_inches='tight', dpi=150)
plt.show()
執行結果:

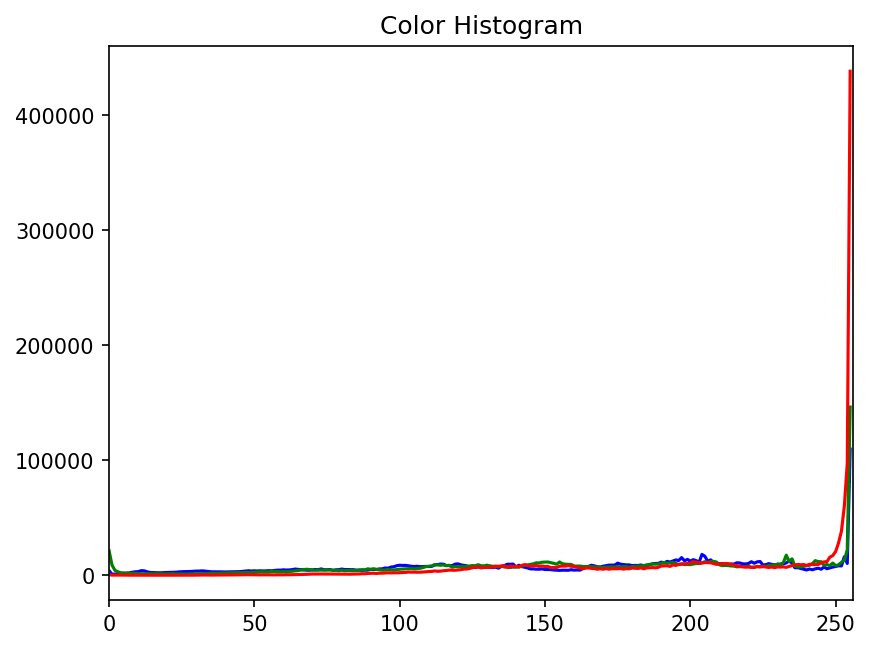
a: 輸入。b: 輸出。
Example 3: 累積多個影像的 histogram
假設您有一系列影像,並且您想要計算這些影像的 cumulative histogram (累積直方圖)。
import cv2
import numpy as np
from matplotlib import pyplot as plt

img_paths = ['sakura.png', 'angel.png']

# Initialize an empty histogram with 256 bins
cumulative_hist = np.zeros([256, 1], dtype="float32")

for img_path in img_paths:
	img = cv2.imread(img_path, 0)
	hist = cv2.calcHist([img], [0], None, [256], [0, 256],
	                    hist=cumulative_hist, accumulate=True)
	print(sum(hist), sum(cumulative_hist))

plt.figure()
plt.plot(hist)
plt.title('Cumulative Histogram for Multiple Images')
plt.savefig('Cumulative Histogram for Multiple Images.png', bbox_inches='tight', dpi=150)
plt.show()
執行結果:
[1835008.] [1835008.]
[4210688.] [4210688.]
Example 4: 每個 Channel 的 Histogram
import cv2
import numpy as np
import mplcyberpunk
from matplotlib import pyplot as plt

plt.style.use("cyberpunk")

def plot_and_save_histogram(data, title, xlabel, ylabel, filename, colors=None):
    """
    Plots and saves a histogram.

    :param data: The histogram data.
    :param title: Title of the plot.
    :param xlabel: Label for the X-axis.
    :param ylabel: Label for the Y-axis.
    :param filename: Filename to save the plot.
    :param colors: Optional colors for the plot lines.
    """
    plt.figure()
    if colors:
        for i, color in enumerate(colors):
            plt.plot(data[i], color=color)
            plt.xlim([0, 256])
    else:
        plt.plot(data)
        plt.xlim([0, 256])

    plt.title(title)
    plt.xlabel(xlabel)
    plt.ylabel(ylabel)
    mplcyberpunk.add_gradient_fill(alpha_gradientglow=0.8)
    plt.savefig(filename, bbox_inches='tight', dpi=150)

# Load the image
img = cv2.imread('sakura.png')

# Convert to grayscale and calculate histogram
gray = cv2.cvtColor(img, cv2.COLOR_BGR2GRAY)
gray_hist = cv2.calcHist([gray], [0], None, [256], [0, 256])

# Plot and save grayscale histogram
plot_and_save_histogram(gray_hist,
                        'Grayscale Histogram',
                        'Pixel Intensity',
                        'Frequency',
                        'grayscale_histogram.png')

# Calculate histograms for each color channel
color_bgr = ('#A3B8FF', '#83FF75', '#FF7974')
color_hists = [cv2.calcHist([img], [i], None, [256], [0, 256]) for i in range(3)]

# Plot and save color histogram
plot_and_save_histogram(color_hists,
                        'Color Histogram',
                        'Pixel Intensity',
                        'Frequency',
                        'color_histogram.png',
                        color_bgr)

# Print total pixel count for the grayscale image
print(f"Total pixel count: {np.sum(gray_hist)}")
plt.show()
執行結果:

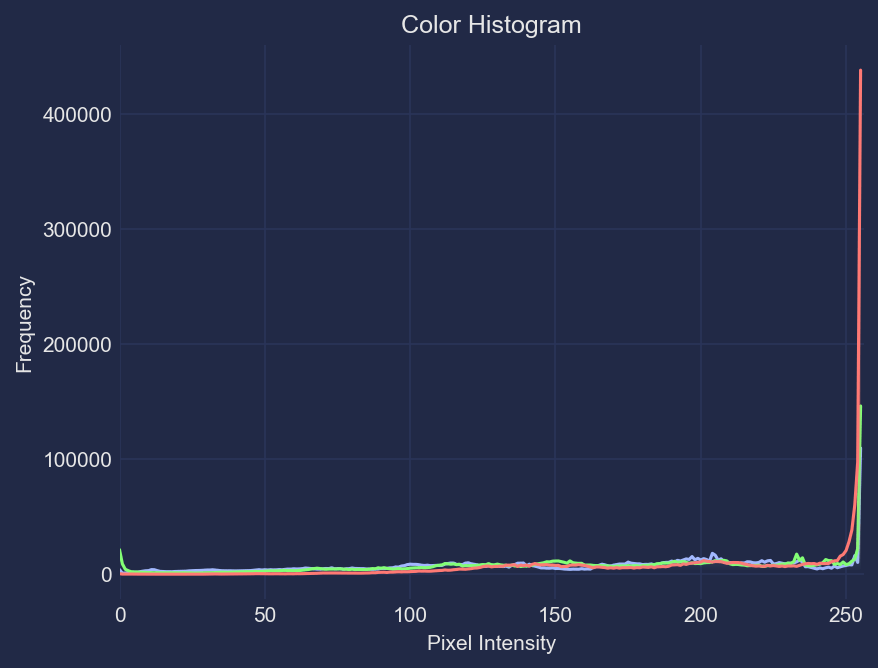
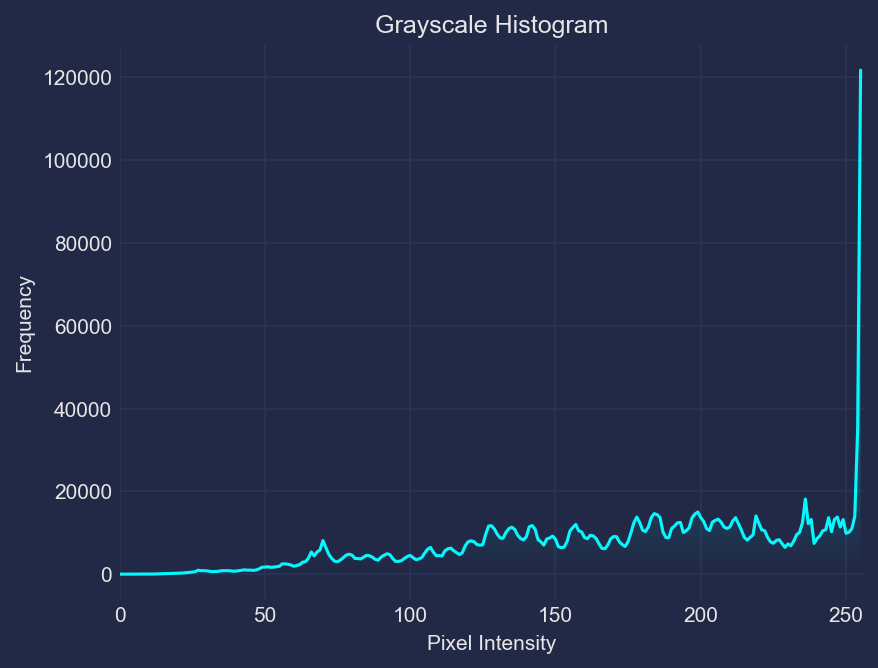
a: 輸入。b: 輸出。c: 輸出。
Example 5: Histogram Equalization (直方圖均衡)
這是透過擴展強度範圍,來提高影像 contrast (對比度) 的過程。
import cv2
import numpy as np
import mplcyberpunk
from matplotlib import pyplot as plt

plt.style.use("cyberpunk")

def plot_and_save_histogram(data, title, xlabel, ylabel, filename, colors=None):
    """
    Plots and saves a histogram.

    :param data: The histogram data.
    :param title: Title of the plot.
    :param xlabel: Label for the X-axis.
    :param ylabel: Label for the Y-axis.
    :param filename: Filename to save the plot.
    :param colors: Optional colors for the plot lines.
    """
    plt.figure()
    if colors:
        for i, color in enumerate(colors):
            plt.plot(data[i], color=color)
            plt.xlim([0, 256])
    else:
        plt.plot(data)
        plt.xlim([0, 256])

    plt.title(title)
    plt.xlabel(xlabel)
    plt.ylabel(ylabel)
    mplcyberpunk.add_gradient_fill(alpha_gradientglow=0.8)
    plt.savefig(filename, bbox_inches='tight', dpi=150)

# Load the image
img = cv2.imread('106183204_p0.png')

# Convert to grayscale and calculate histogram
gray = cv2.cvtColor(img, cv2.COLOR_BGR2GRAY)
equ_img = cv2.equalizeHist(gray)

gray_hist = cv2.calcHist([gray], [0], None, [256], [0, 256])
equ_hist = cv2.calcHist([equ_img], [0], None, [256], [0, 256])

cv2.imwrite('Gray Image.png', gray)
cv2.imwrite('Equalized Image.png', equ_img)

# Plot and save grayscale histogram
plot_and_save_histogram(gray_hist,
                        'Grayscale Histogram',
                        'Pixel Intensity',
                        'Frequency',
                        'grayscale_histogram.png')

plot_and_save_histogram(equ_hist,
                        'Equalized Histogram',
                        'Pixel Intensity',
                        'Frequency',
                        'equalized_histogram.png')

plt.show()
執行結果:


a: 輸入。b: 輸出。

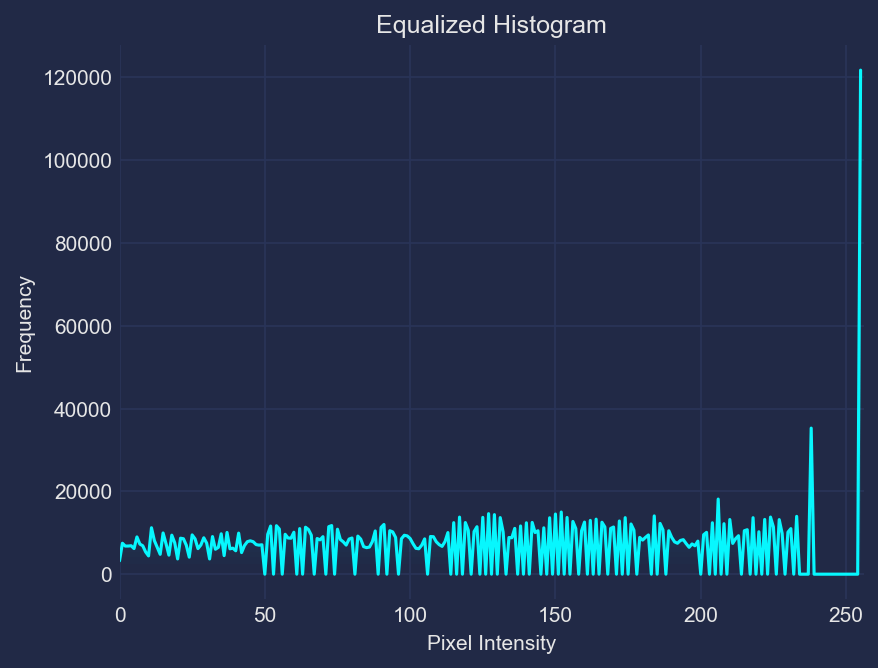
a: 輸入。b: 輸出。
equalizeHist()
用於灰階影像 (單一 channel) 的 histogram equalization。Histogram equalization 是一種調整影像強度,以增強 contrast (對比度) 的技術。
Histogram equalization 的主要用途是在影像預處理中,特別是在需要 standardize 多個影像的照明條件或增強 contrast,以更好地提取特徵的情況下。
equalizeHist(src) ->dst
| 參數 | 說明 |
|---|---|
| src | 來源影像,應該是灰階影像 (8-bit)。 |
cv2.createCLAHE(),它將影像分割為 blocks 並對每個 block 應用 histogram equalization。這可以防止相對均勻區域中的 noise 過度放大。
Histogram equalization 可以與其他預處理技術結合使用 (例如: denoising、sharpening 等) ,以增強結果,特別是在複雜的影像處理任務中。
謹慎對待有大量 noise 的影像。Histogram equalization 可以增加 noise 的可見度。- Histogram
Histogram $H(i)$ 是一個函數,用於計算每個強度值 $i$ 在影像中出現的次數。 (範圍從 0 到 $L-1$,其中 $L$ 是可能的強度 levels 數量)
$$H(i) = \text{Number of pixels with intensity } i$$
- Cumulative Distribution Function (CDF)
$CDF(i)$ 對於強度 level $i$,是直到該強度的 histogram 值的累積和。在數學上,它表示為:
$$CDF(i) = \sum_{j=0}^{i} H(j)$$
這意味著對於每個強度等級 $i$,CDF 給出強度小於或等於 $i$ 的像素總數。
- Minimum CDF
$CDF_{\text{min}}$ 是 CDF 中最小的非零值。其計算公式為:
$$CDF_{\text{min}} = \min\{ CDF(i) \,|\, CDF(i) > 0 \}$$
該值用於避免在 normalization 步驟中出現零分母,並從影像中存在的最低強度開始 equalization (忽略具有零像素的強度)。
- 總像素數量
影像中的像素總數 $N$ 是 histogram 中所有值的總和,這也是 CDF 的最後一個值 (因為它是累積和)。這可以表示為:
$$N = CDF(L-1) = \sum_{i=0}^{L-1} H(i)$$
- Histogram Equalization
Equalized 影像中每個原始強度 $i$ 的新強度值 $H_{\text{eq}}(i)$ 的公式為:
$$H_{\text{eq}}(i) = \left( \frac{CDF(i) - CDF_{\text{min}}}{N - CDF_{\text{min}}} \right) \times (L - 1)$$
此公式將 CDF normalizes 為 $[0, L-1]$ 範圍 (對於 8-bit 影像,通常為 $L = 256$),從而將強度值分佈在整個範圍內,從而增強影像的對比度。
Example 1: Basic Usage
import cv2

# Read the image in grayscale
gray_image = cv2.imread('path_to_image.jpg', cv2.IMREAD_GRAYSCALE)

# Apply histogram equalization
equalized_image = cv2.equalizeHist(gray_image)

# Display the images
cv2.imwrite('Gray Image.png', gray_image)
cv2.imwrite('Equalized Image.png', equalized_image)
執行結果:

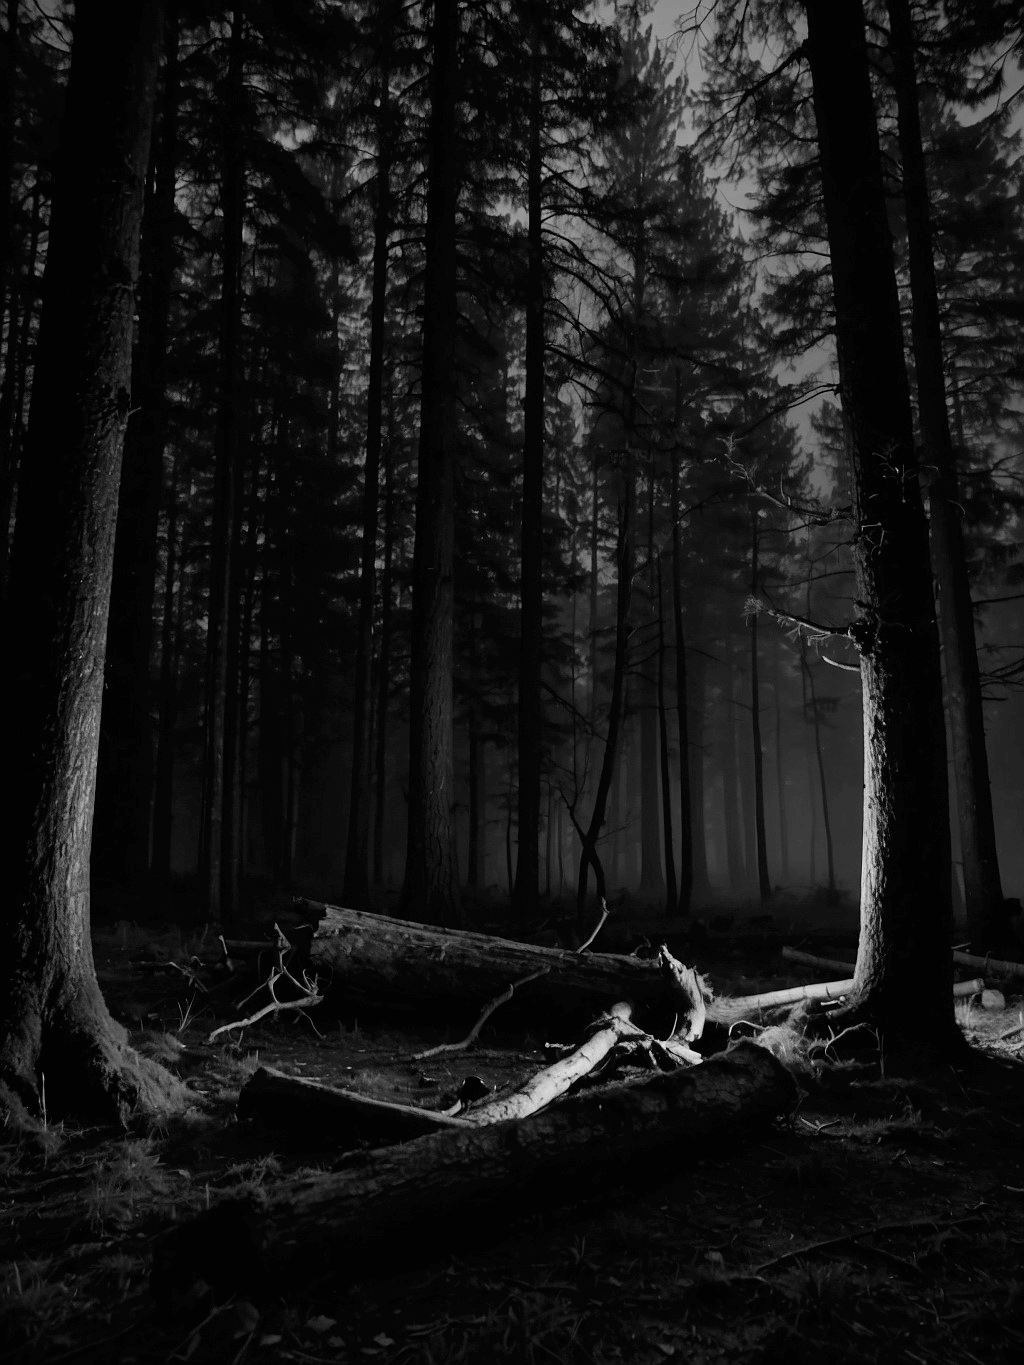

a: 原始影像。b: 輸入。c: 輸出。


a: 原始影像。b: 輸入。c: 輸出。
Example 2: 與彩色影像相結合
雖然 cv.equalizeHist 只適用於 grayscale 影像,但您可以將其應用於 HSV, YUV 或 CIELAB 等色彩空間中的 luminance channel ,然後再將其轉換回 RGB。
- 如果您的應用對人類感知色彩和亮度的方式很敏感,那麼 CIELAB 可能是最佳選擇,因為它具有感知均勻性。
- 如果應用對色彩和亮度的分離非常重要,而且任務高度依賴於色彩 (如基於色彩的物體跟蹤),則 HSV 更為可取。
- YUV 屬於中間值,在視訊處理和需要處理光照變化的應用中特別有用。
import cv2

# Read the image
image = cv2.imread('dark night.jpg')
image_lab = cv2.cvtColor(image, cv2.COLOR_BGR2Lab)

# Equalize the histogram of the L channel
image_lab[:, :, 0] = cv2.equalizeHist(image_lab[:, :, 0])

# Convert back to RGB
equalized_lab_image = cv2.cvtColor(image_lab, cv2.COLOR_Lab2BGR)
cv2.imwrite('Equalized Color Image.png', equalized_lab_image)
執行結果:


a: 輸入。c: 輸出。


a: 輸入。c: 輸出。
Example 3: 與彩色影像相結合 (HSV)
import cv2

# Read the image
image = cv2.imread('path_to_color_image.jpg')

# Convert to HSV
image_hsv = cv2.cvtColor(image, cv2.COLOR_BGR2HSV)

# Equalize the histogram of the V channel
image_hsv[:, :, 2] = cv2.equalizeHist(image_hsv[:, :, 2])

# Convert back to RGB
equalized_hsv_image = cv2.cvtColor(image_hsv, cv2.COLOR_HSV2BGR)
cv2.imwrite('Equalized Color Image.png', equalized_hsv_image)
執行結果:


a: 輸入。c: 輸出。


a: 輸入。c: 輸出。
createCLAHE()
Contrast Limited Adaptive Histogram Equalization. (CLAHE; 對比度有限自適應直方圖均衡) 它廣泛應用於醫學影像、衛星影像和攝影。
cv.createCLAHE(clipLimit = 40.0,
			   tileGridSize = (8, 8)) -> retval
| 參數 | 說明 |
|---|---|
| clipLimit | 設定 contrast 限制的閾值,通常在 1.0 到 4.0 的範圍。 較高的 clipLimit 值會增加一定程度的 contrast,但也會放大 noise。相反,較低的值將限制這種效果,但可能導致 contrast 增強不太明顯。 |
| tileGridSize | 指定影像將被劃分成的 grid 的大小。Histogram equalization 單獨應用於每個 grid tile (網格磚),從而實現局部對比增強。通常為 (8, 8) 或 (16, 16)。較小的 tiles 可以帶來更詳細的 contrast 增強,但它們也可能放大雜訊。較大的 tiles 提供更廣泛的增強。 |
CLAHE 可能需要大量計算,尤其是在 tile 尺寸較小且解析度較高的情況下。如果在 real-time 應用程式中使用 CLAHE,請務必考慮效能影響。
CLAHE 的最佳參數在很大程度上取決於應用。例如: 醫學成像可能需要與衛星影像或攝影不同的設定。- 劃分為 Tiles。
影像被分割為不重疊的 tiles,通常大小為 8x8 或 16x16 像素。
- Histogram 計算
對於每個 tile,計算其 histogram $H(i)$,其中 $i$ 範圍從 0 (黑色) 到$L-1$ (白色),$L$ 是影像中可能的強度等級的數量 (通常 8-bit 影像為 256)。
- Clip 限制和 Contrast 限制
定義 clip 限制 $C$ 來限制 contrast。這個想法是重新分配超過此限制的 histogram 條目。 Clip 限制通常是每個 bin 的平均像素數的函數,並透過使用者定義的 clip 係數進行調整。
如果對任何 $i$,$H(i) > C$,則多餘的 $H(i) - C$ 均勻地重新分配到所有 histogram bins。Iteratively 執行此過程,直到所有 bin 的值都小於或等於 $C$。這可以表示為:
$$H_{\text{clipped}}(i) = \min(H(i), C) + \frac{1}{L} \sum_{j=0}^{L-1} \max(H(j) - C, 0)$$
其中 $H_{\text{clipped}}(i)$ 是 contrast 限制後的 histogram。
- Histogram Equalization
對於每個 tile,Clipped histogram 用於計算 Cumulative Distribution Function (CDF),然後將其 normalized 以將 histogram 對應到影像的完整顯示範圍:
$$CDF(i) = \frac{\sum_{j=0}^{i} H_{\text{clipped}}(j)}{\sum_{j=0}^{L-1} H_{\text{clipped}}(j)}$$
然後透過此 normalized CDF 映射原始像素值來獲得新的像素值,從而有效地擴展強度範圍並提高對比度:
其中 $I_{x,y}$ 是位置 $(x,y)$ 處像素的原始強度,$I'_{x,y}$ 是均衡後的新強度。
- Bilinear Interpolation (雙線性插值)
為了避免人為地在 tiles 之間產生邊界,CLAHE 演算法在 tile borders,插入像素值。這涉及到使用四個最近的 tile corners 的均衡值並應用 bilinear interpolation:
其中 $a、b、c、$ 和 $d$ 是基於 $(x,y)$ 到 four corners 的距離的插值係數,$I''_{x,y}$ 是 $(x, y)$ 處的最終插值強度值。
Example 1: Basic Usage
import cv2 as cv

image = cv.imread('path_to_image.jpg')
image_gray = cv.cvtColor(image, cv.COLOR_BGR2GRAY)

# Create a CLAHE object
clahe = cv.createCLAHE(clipLimit=2.0, tileGridSize=(8, 8))

# Apply CLAHE
enhanced_img = clahe.apply(image_gray)

cv.imwrite('Gray Image.png', image_gray)
cv.imwrite('CLAHE Enhanced Image.png', enhanced_img)
執行結果:


a: 原始影像。b: 輸入。c: 輸出。


a: 原始影像。b: 輸入。c: 輸出。
Example 2: 處理彩色影像
彩色影像需要不同的方法,因為 CLAHE 通常應用於灰階影像。一種常見的方法是將影像轉換為 HSV 或 LAB 等色彩空間,將 CLAHE 應用於 luminance channel,然後轉換回 RGB。
import cv2 as cv

image = cv.imread('path_to_image.jpg')
image_lab = cv.cvtColor(image, cv.COLOR_BGR2Lab)

# Apply CLAHE to L-channel
clahe = cv.createCLAHE(clipLimit=3.0, tileGridSize=(8, 8))
image_lab[:, :, 0] = clahe.apply(image_lab[:, :, 0])

# Convert back to RGB
equalized_lab_image = cv.cvtColor(image_lab, cv.COLOR_Lab2BGR)
cv.imwrite('CLAHE Enhanced Image.png', equalized_lab_image)
執行結果:


a: 輸入。b: 輸出。


a: 輸入。b: 輸出。
Example 3: 處理彩色影像 (HSV)
import cv2 as cv

image = cv.imread('path_to_image.jpg')
image_hsv = cv.cvtColor(image, cv.COLOR_BGR2HSV)

# Apply CLAHE to V-channel
clahe = cv.createCLAHE(clipLimit=3.0, tileGridSize=(8, 8))
image_hsv[:, :, 2] = clahe.apply(image_hsv[:, :, 2])

# Convert back to RGB
equalized_hsv_image = cv.cvtColor(image_hsv, cv.COLOR_HSV2BGR)
cv.imwrite('CLAHE Enhanced Image.png', equalized_hsv_image)
執行結果:


a: 輸入。b: 輸出。


a: 輸入。b: 輸出。
Methods
將 CLAHE 演算法應用於輸入影像。輸入通常是 grayscale 影像。
CLAHE.apply(src) -> dst
設定 CLAHE 演算法的 contrast 限制的閾值。
CLAHE.setClipLimit( clipLimit) -> None
設定演算法中所使用的 tiles 的 grid 大小。
CLAHE.setTilesGridSize(tileGridSize) -> None
返回 CLAHE 演算法當前使用的 clip 限制。
CLAHE.getClipLimit() -> retval
返回基於 tile 的 contrast 增強的 grid 大小。
CLAHE.getTilesGridSize() -> retval
Example 1: Basic Usage
import cv2 as cv

image = cv.imread('dark night.jpg')
image_gray = cv.cvtColor(image, cv.COLOR_BGR2GRAY)

# Create a CLAHE object
clahe = cv.createCLAHE(clipLimit=2.0, tileGridSize=(8, 8))

# Set a new clip limit and grid size
clahe.setClipLimit(10.0)
clahe.setTilesGridSize((10, 10))

# Apply CLAHE
enhanced_img = clahe.apply(image_gray)

cv.imwrite('Gray Image.png', image_gray)
cv.imwrite('CLAHE Enhanced Image.png', enhanced_img)

# Get the current clip limit and tile grid size
clip_limit = clahe.getClipLimit()
grid_size = clahe.getTilesGridSize()

print(f"Current Clip Limit: {clip_limit}")     # Output: 10.0
print(f"Current Tile Grid Size: {grid_size}")  # Output: (10, 10)
執行結果:


a: 輸入。b: 輸出。
參考資料
OpenCV: cv::CLAHE Class Reference

